Hybrid Waterfall Chart©
Combining quantity & quality enhances transparency using Hybrid Metrics (for more see Hybrid Reporting)
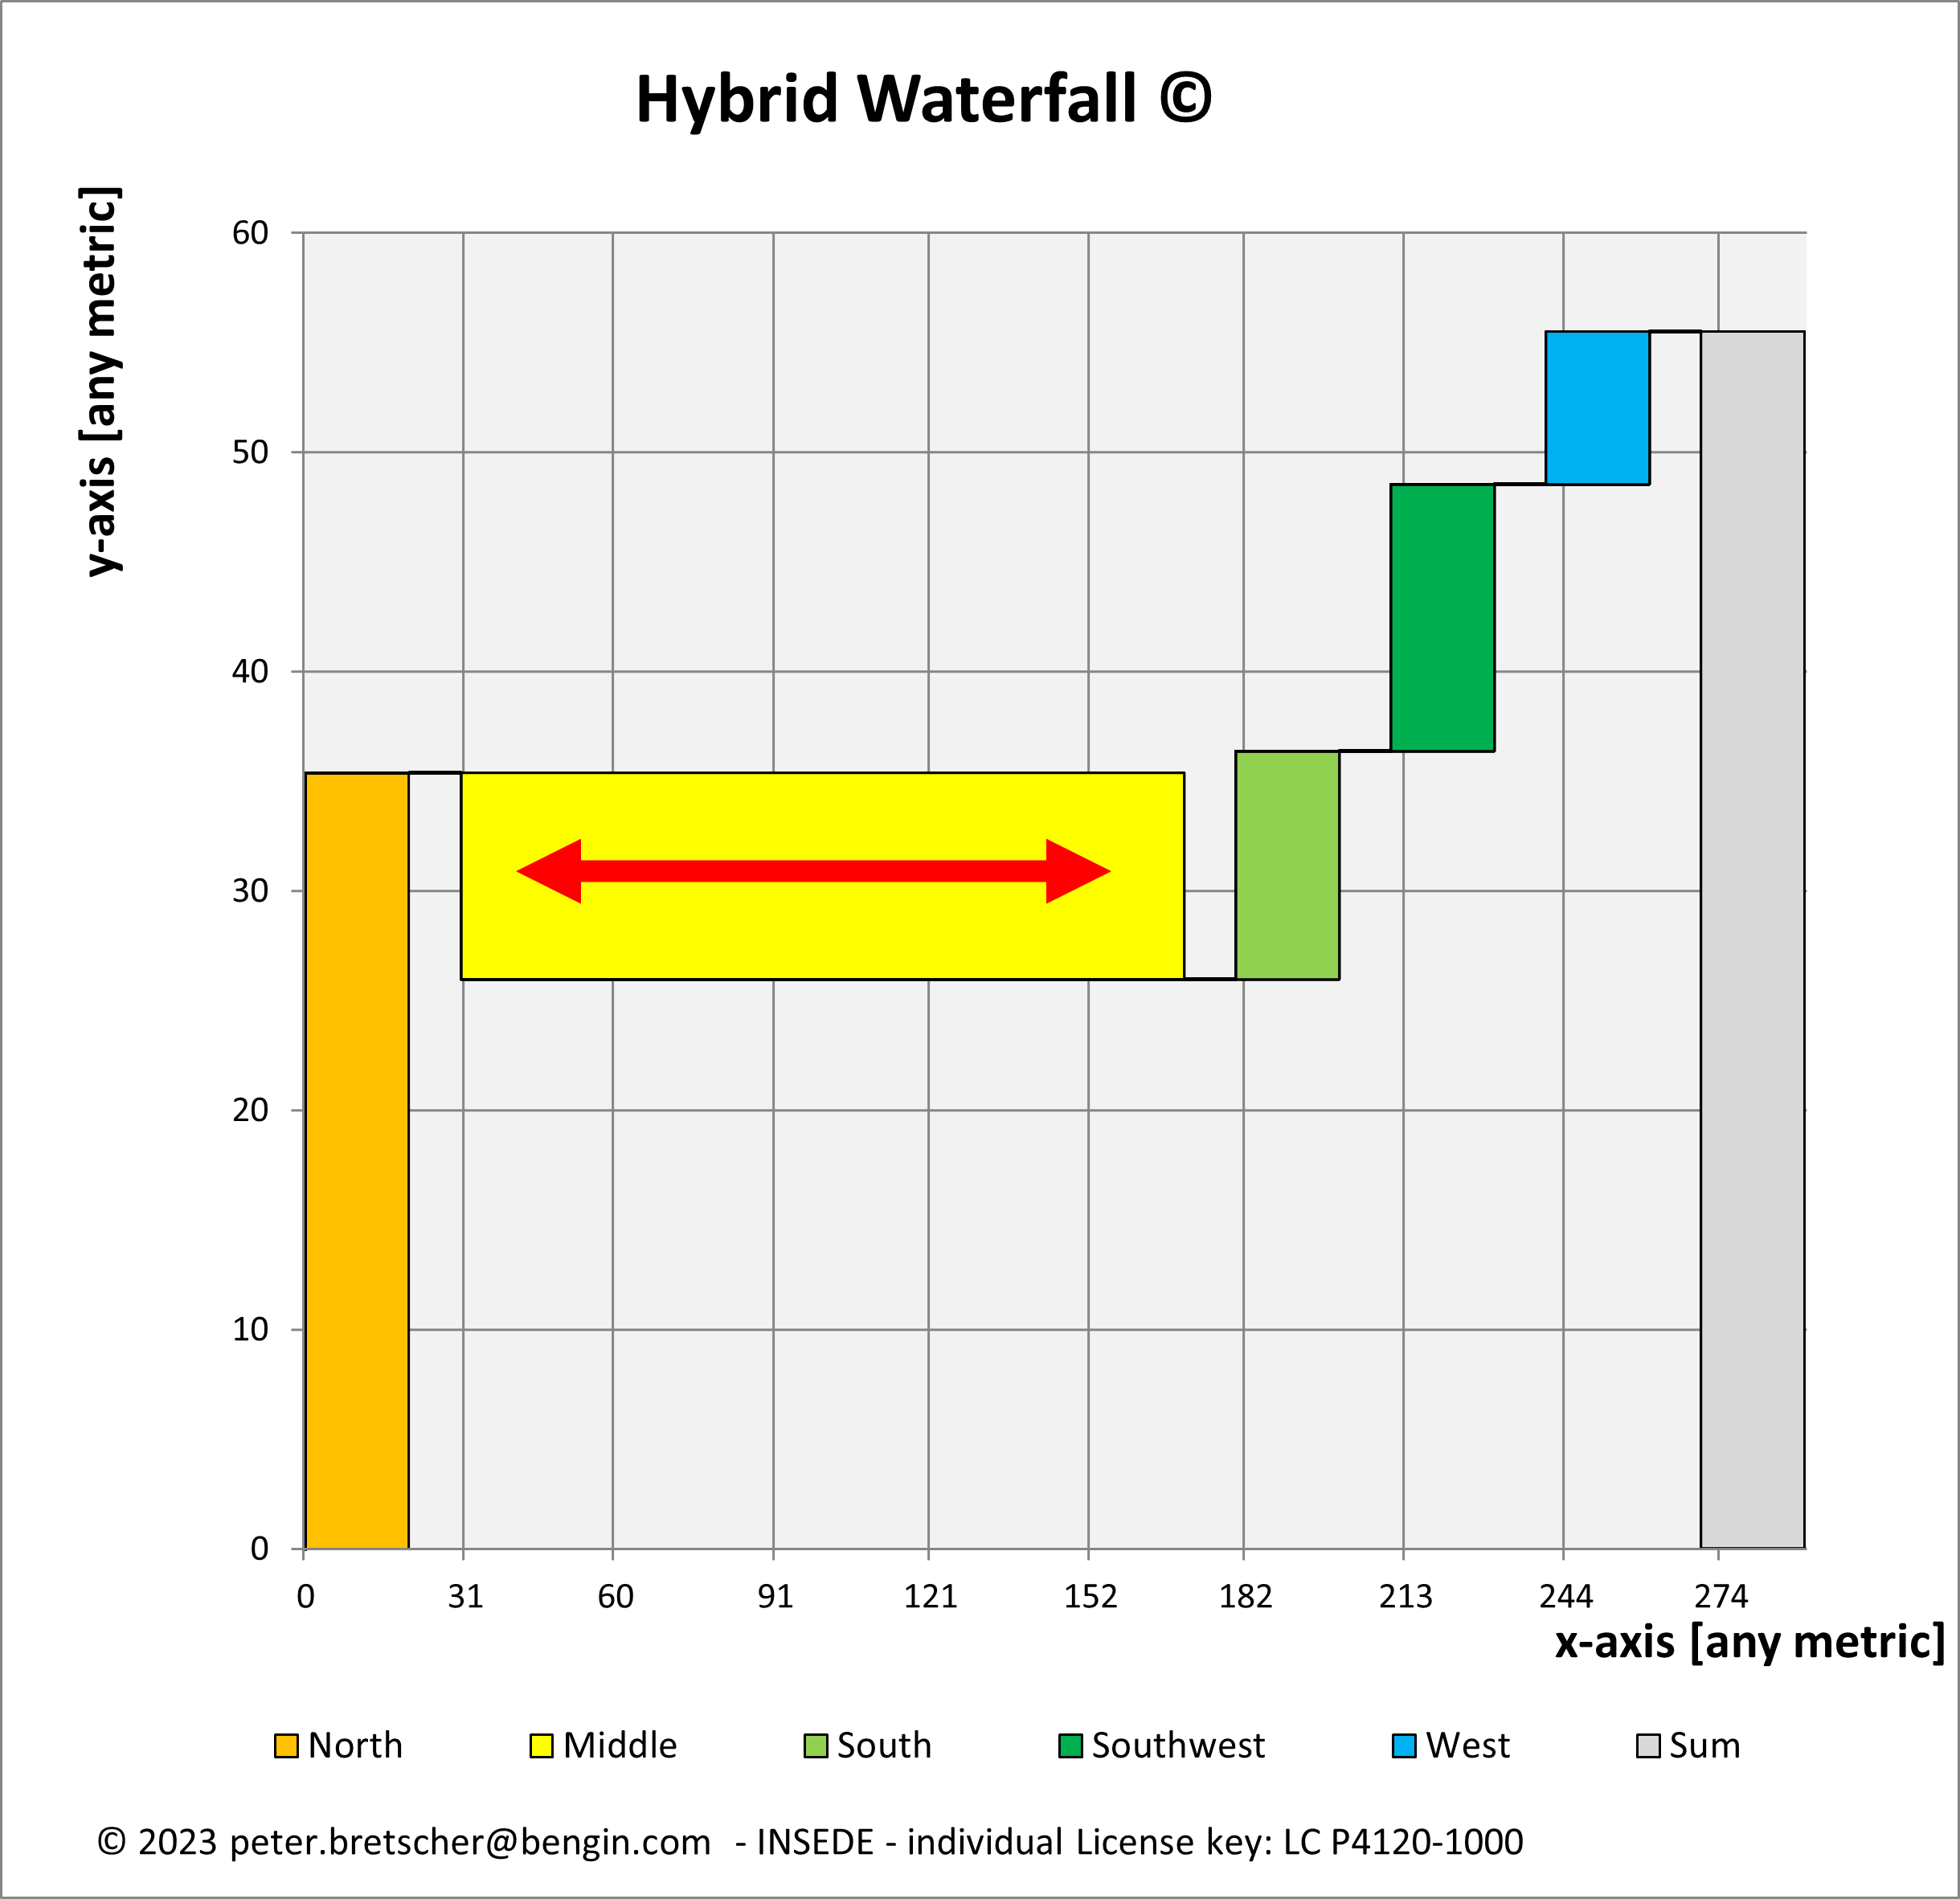
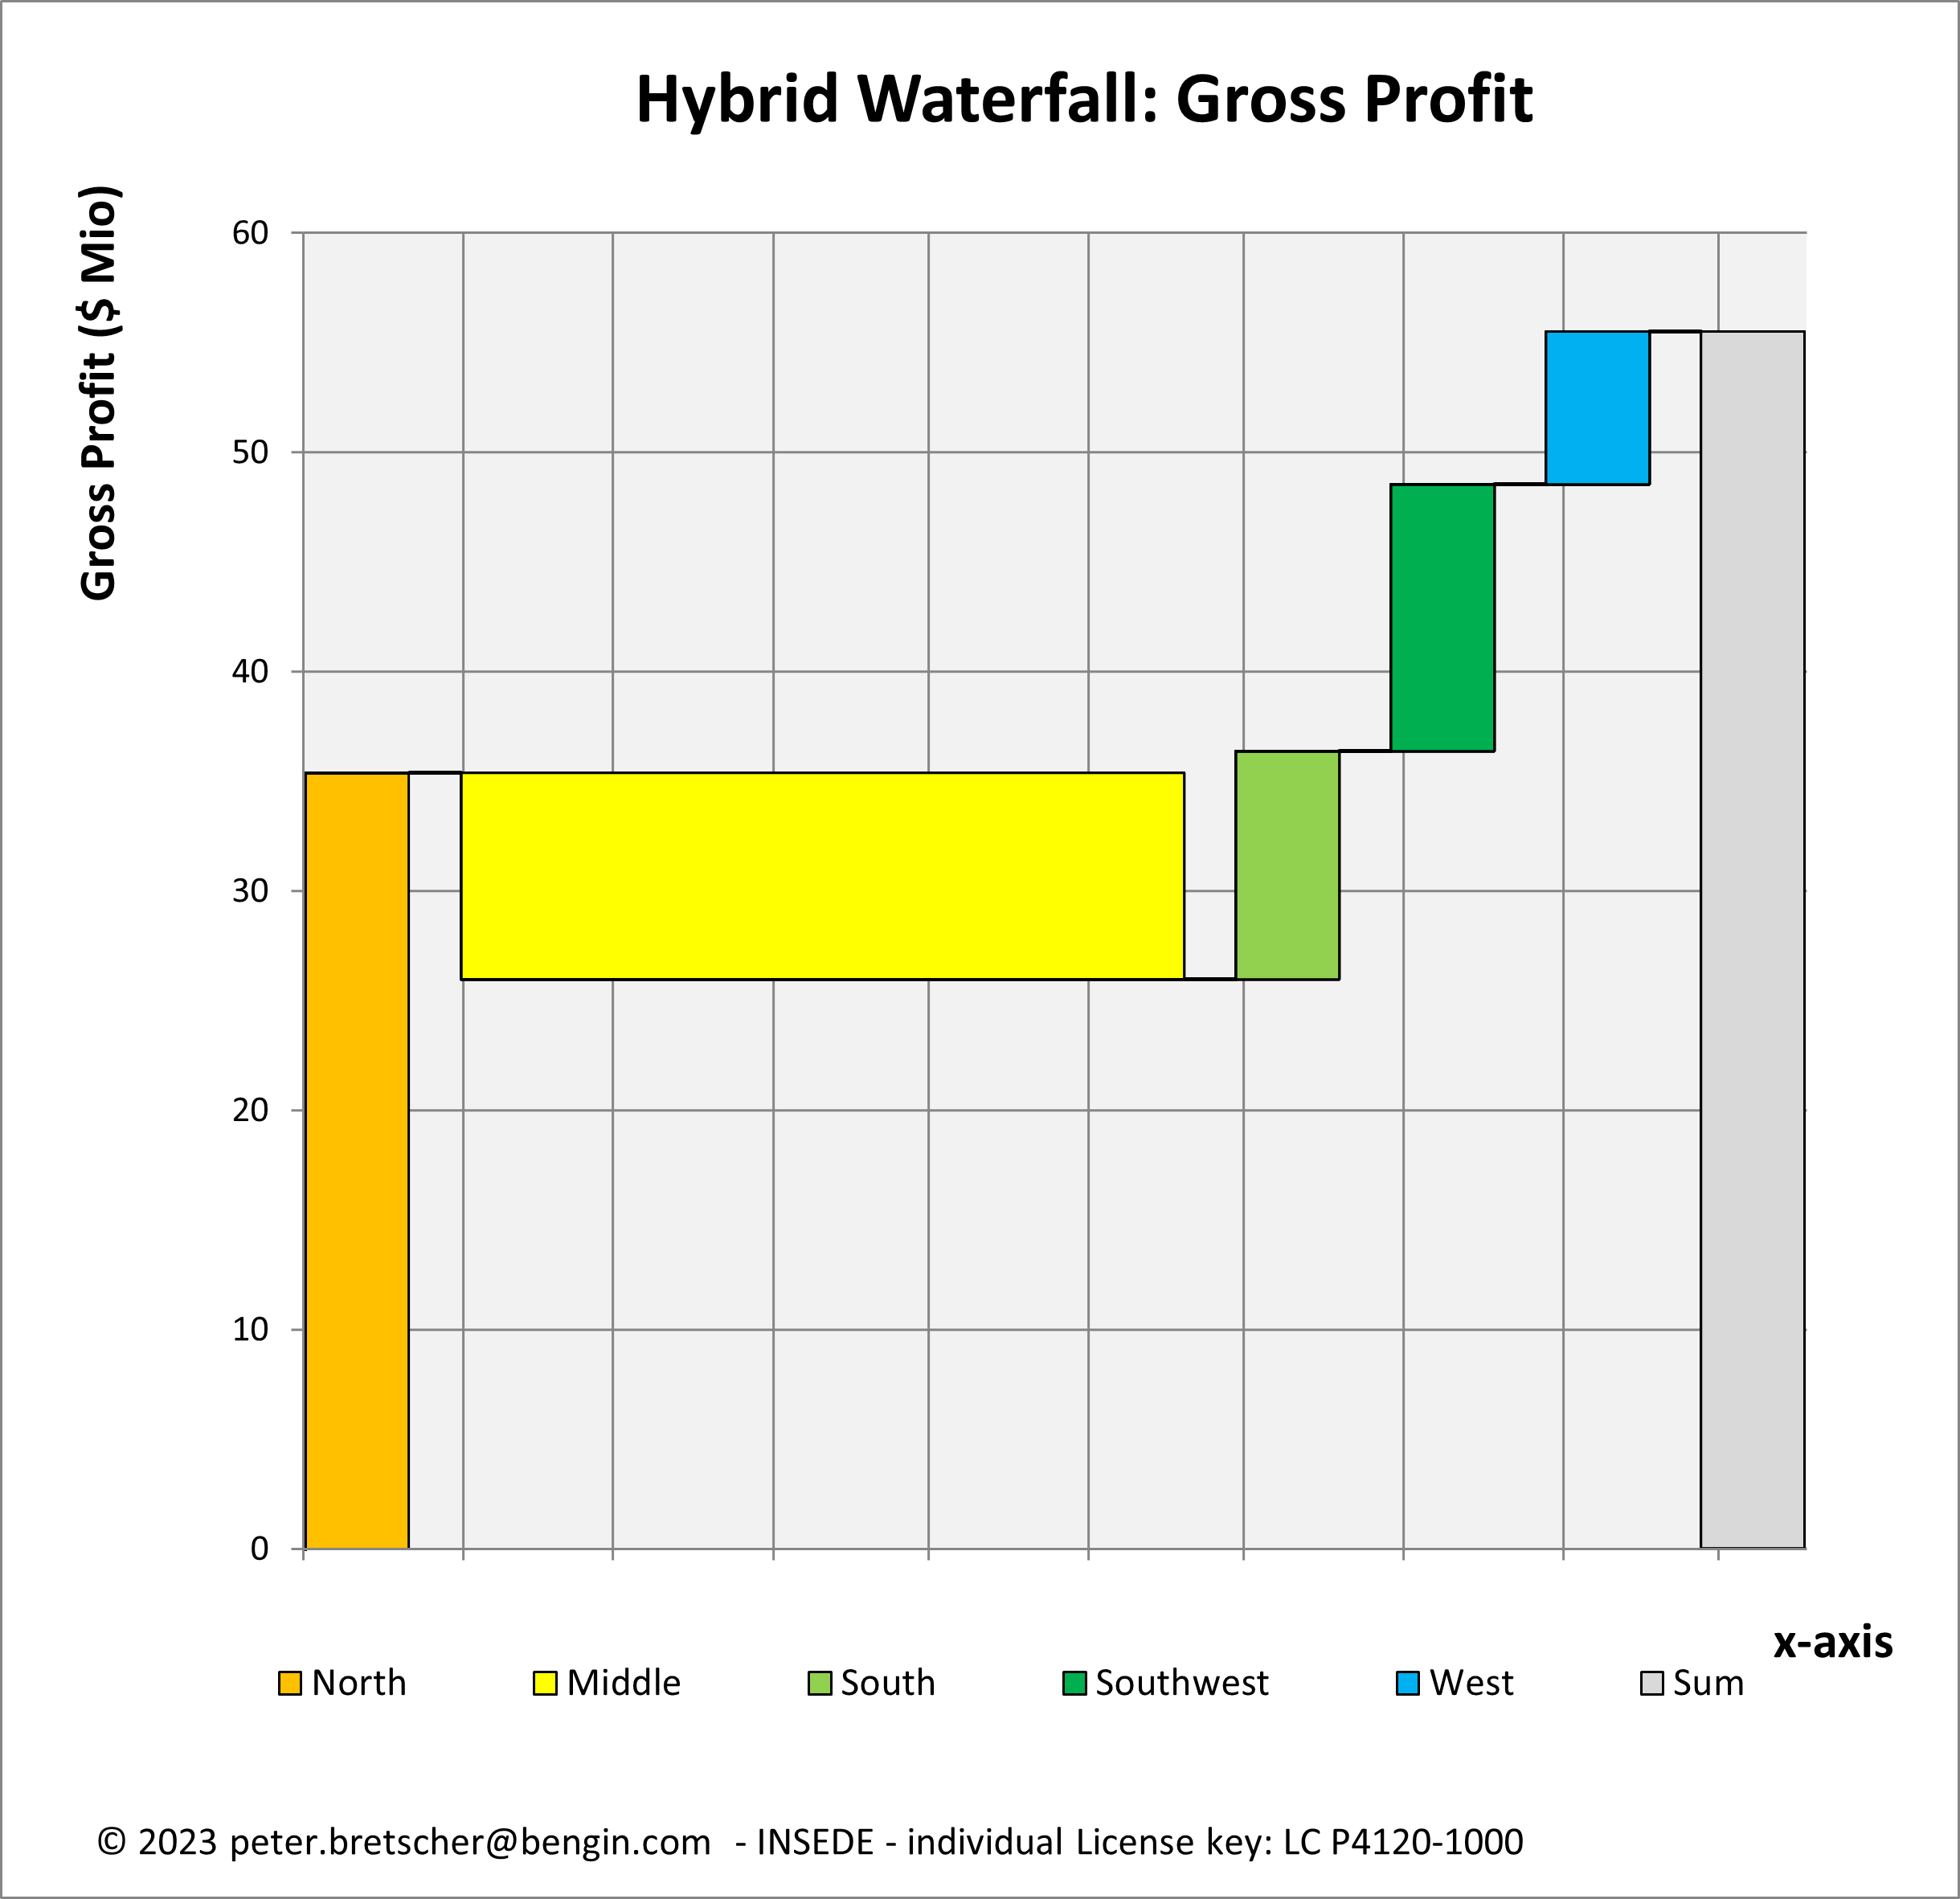
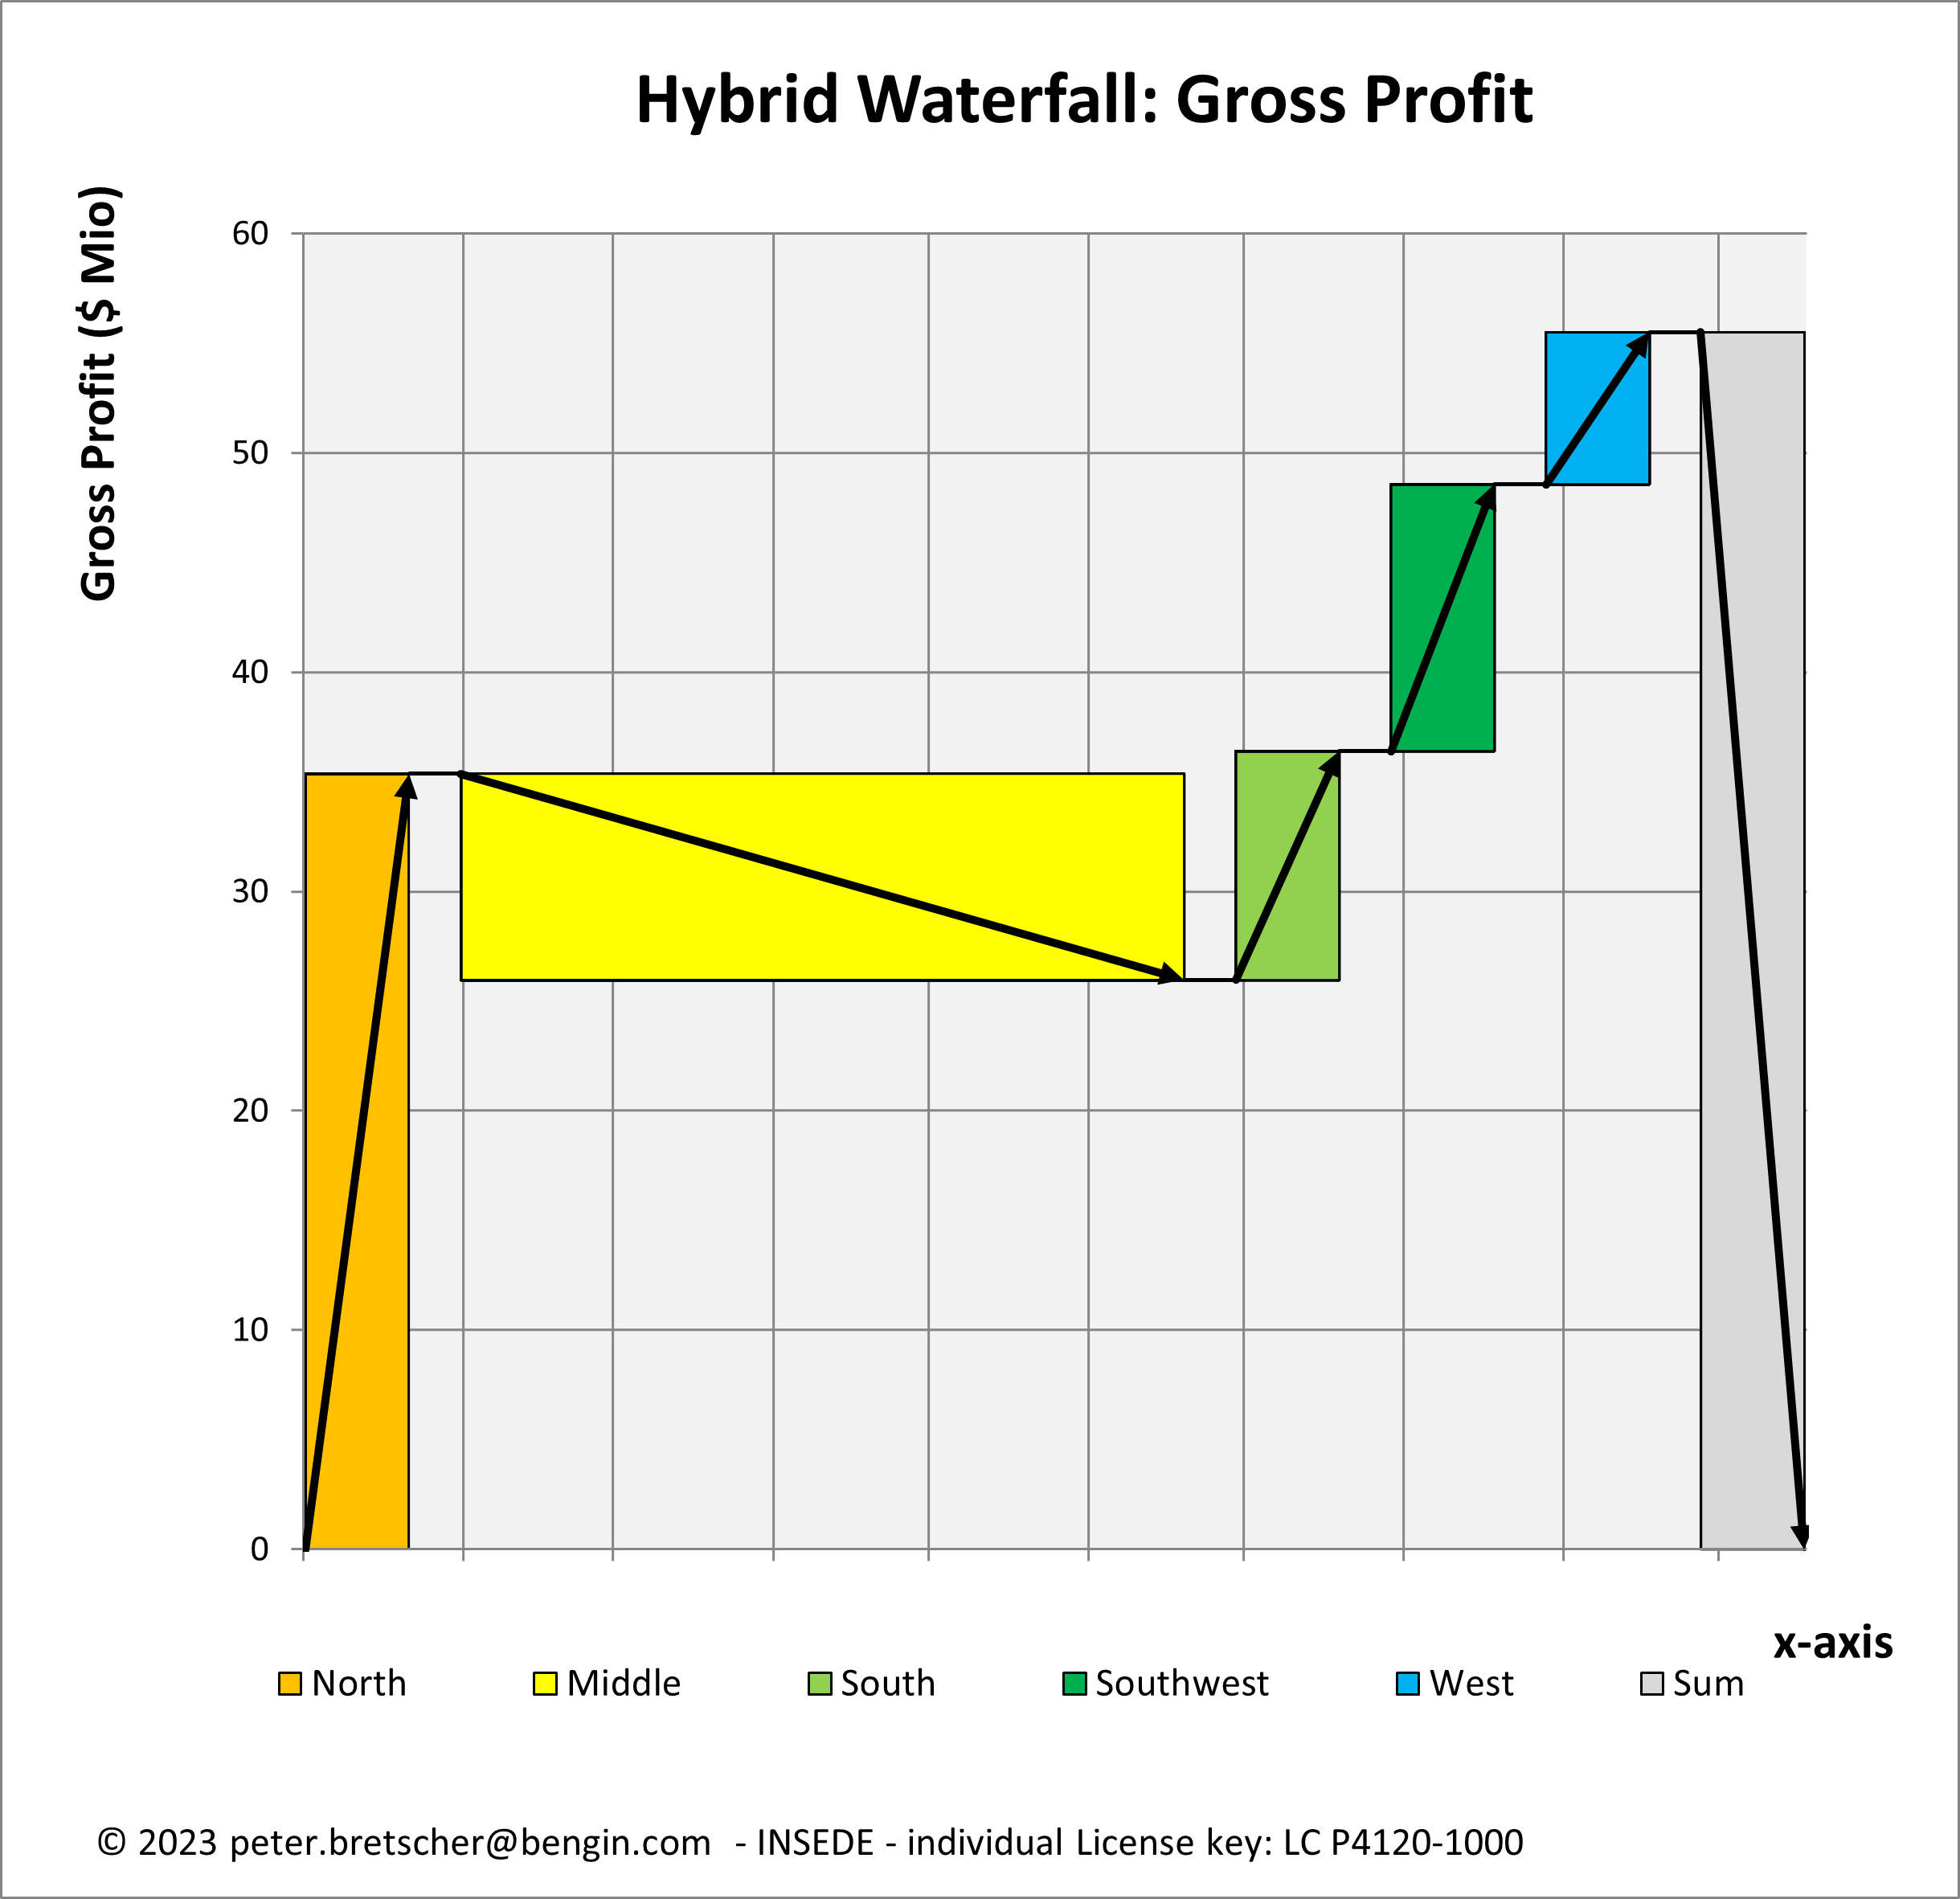
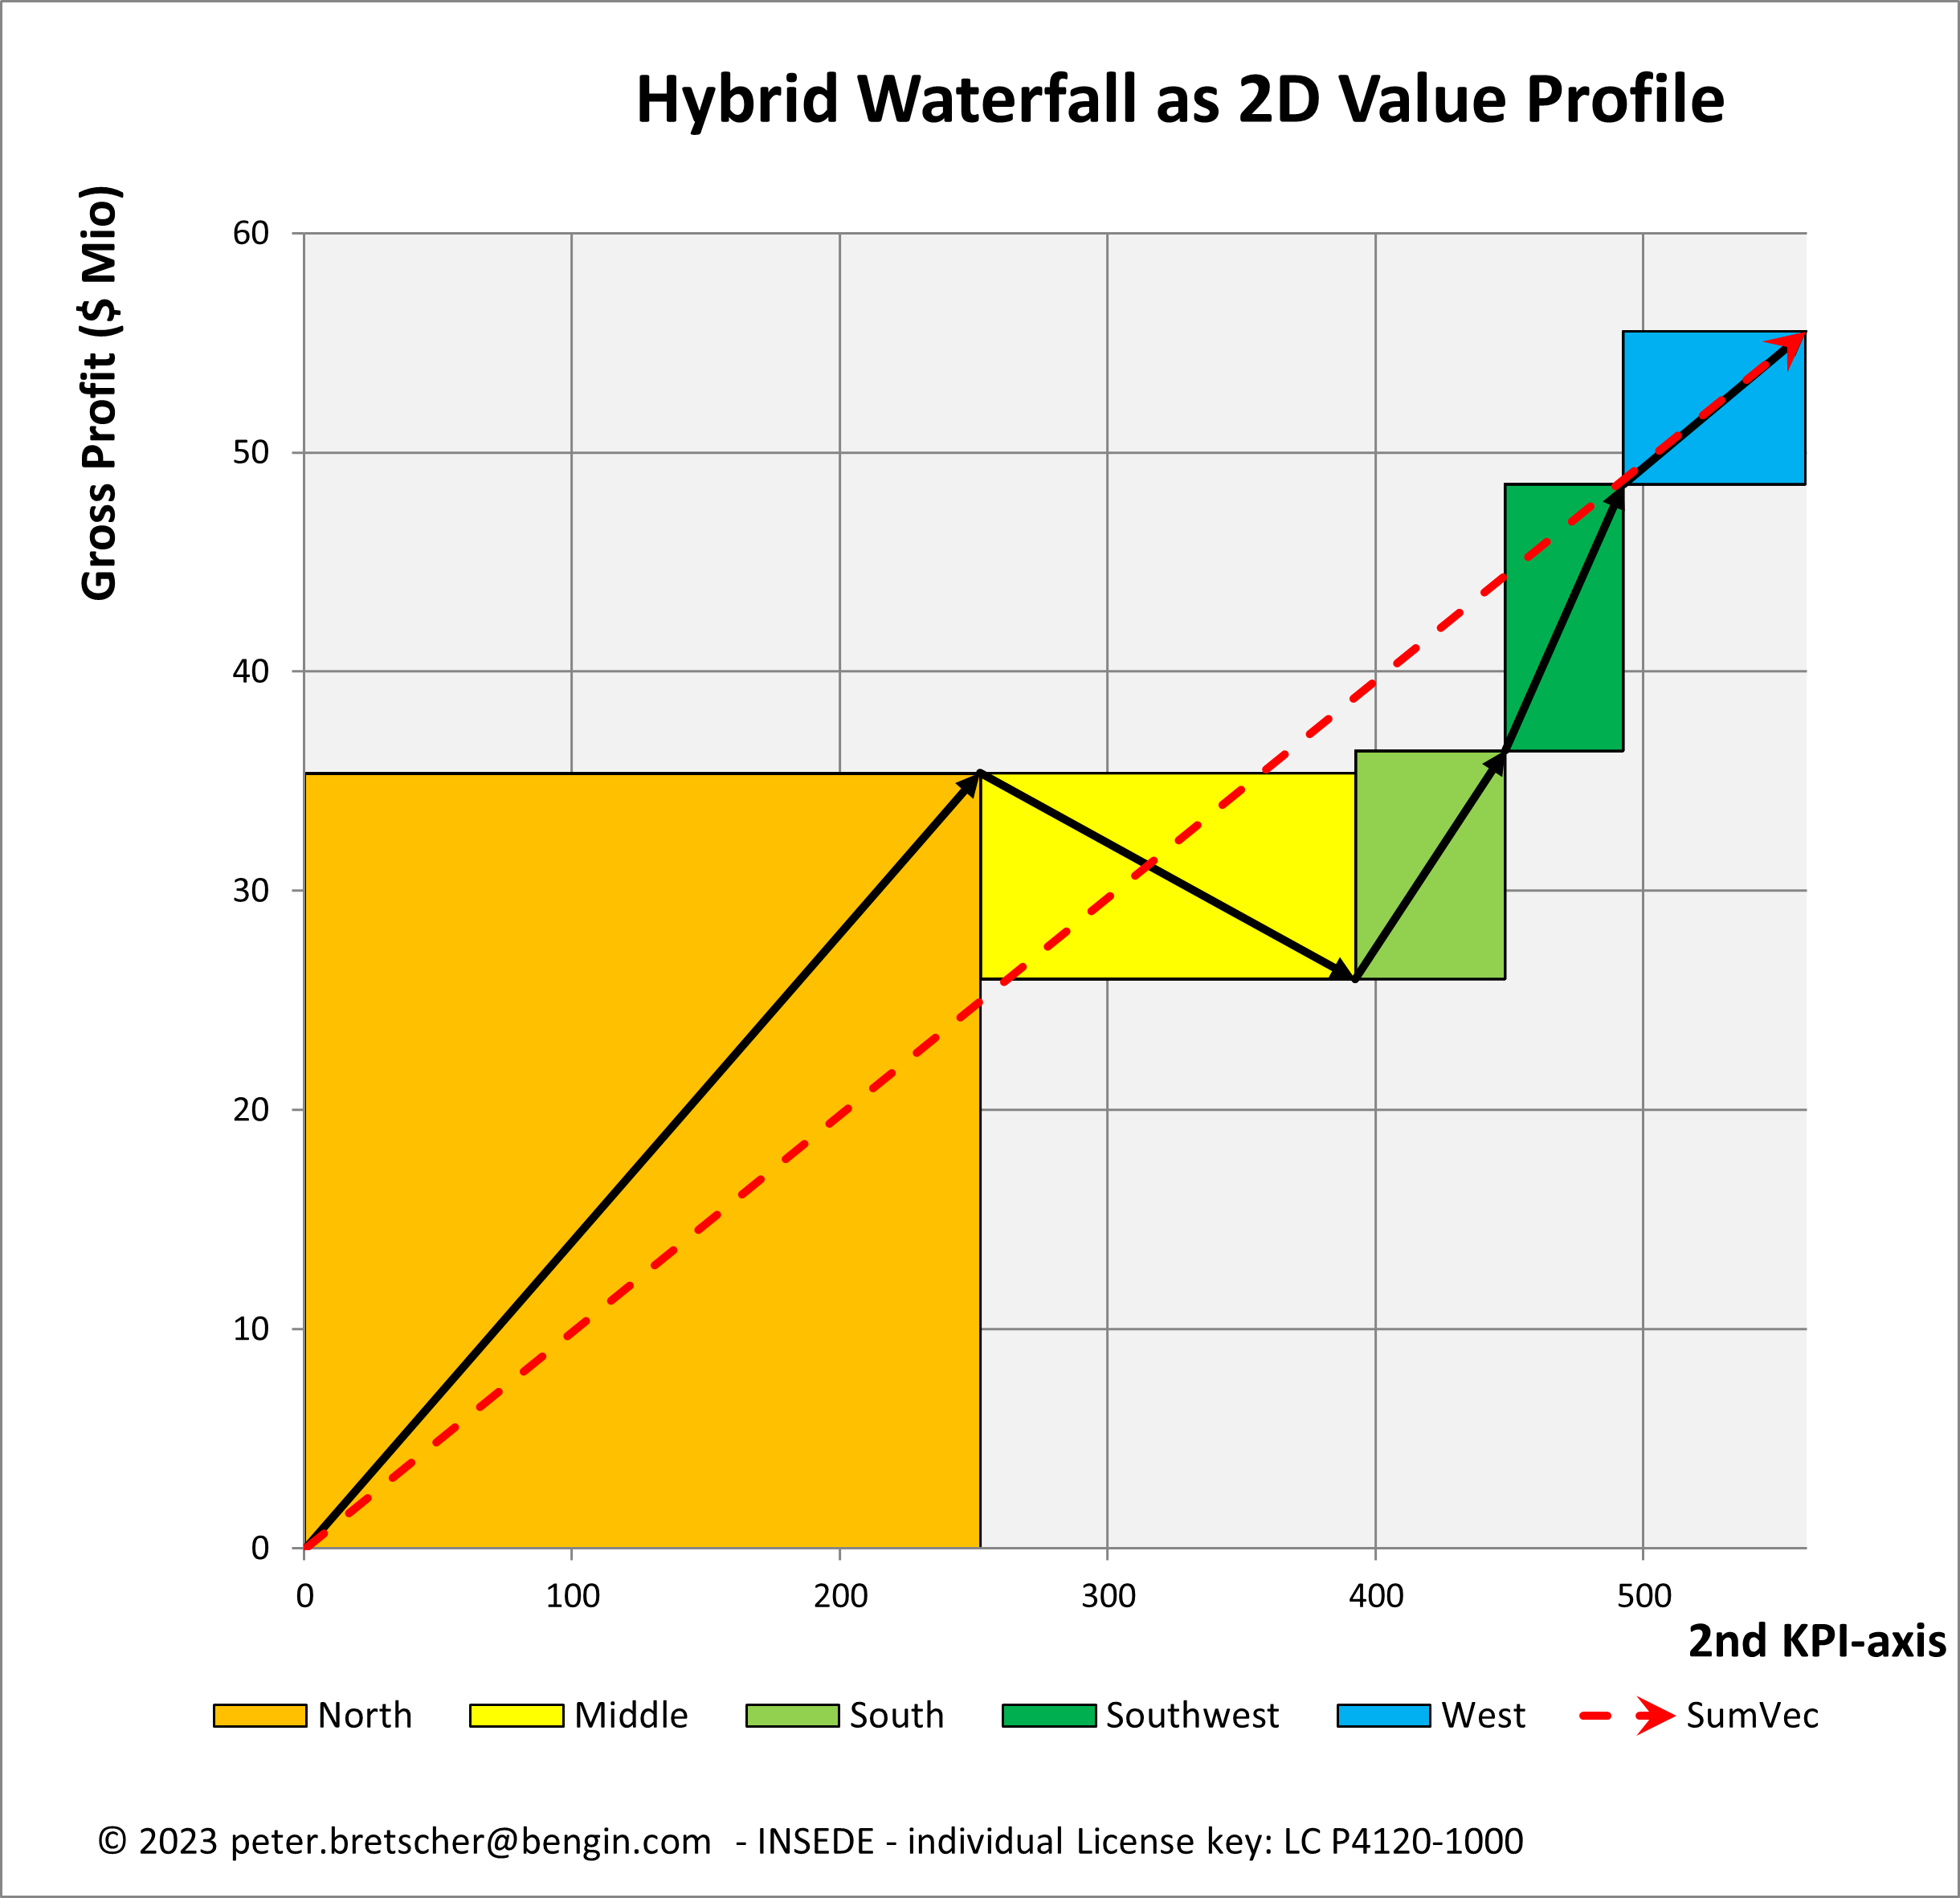
As a proprietary data visualization technique combining two value dimensions (e.g., qualitative and quantitative), the "Hybrid Waterfall chart" offers unique characteristics that set it apart from the "Classic linear Waterfall chart", which typically focuses solely on quantitative data.
Here are some advantages of the "Hybrid Waterfall chart" compared with the "Classic linear Waterfall chart":
- Enhanced Context: By incorporating both qualitative and quantitative data, the "Hybrid Waterfall chart" provides a more comprehensive context for understanding the data. This can offer deeper insights into the factors influencing the numerical values, leading to a more holistic understanding of the information presented.
- Expanded Interpretation: The inclusion of qualitative dimensions allows for a broader interpretation of the data. Users can assess not only the numerical changes but also the qualitative aspects that contribute to those changes, providing a richer analysis.
- Improved Decision-Making: With both quantitative and qualitative information, the "Hybrid Waterfall chart" enables users to make more informed and nuanced decisions. The qualitative insights can offer valuable context and support when interpreting the quantitative trends.
- Effective Communication: The "Hybrid Waterfall chart" can be a powerful tool for communication, especially when conveying complex data to stakeholders. The inclusion of qualitative data helps tell a more complete story and engages the audience better.
- Versatility: The "Hybrid Waterfall chart" can be adaptable to various types of data and scenarios, making it suitable for a wide range of applications beyond financial and numerical analyses.
Try it yourself.
Download free Excel to play around with your individual data here.
You'll find all sheets for the steps pictured below 'til the "Vector Based Value Profile".
Hybrid Waterfall© is part of 'Business Engineering Systems' (a term for a framework and a metric system that helps to explain, map, measure and develop smart economies and Nations.) - registered Copyright TXu 512 154 - commercial use needs adequate license - trials and private use are free (no derivatives).
Questions? Want to know more? -> e-mail: peter.bretscher@bengin.com
Steps from linear Waterfall to Hybrid Waterfalls and Value Profiles
Visualization helps to better explain dependencies and relationships in a multidimensional (virtual) world.
Below some steps from "Classic Waterfall" to use it with hybrid metrics to get the "Hybrid Waterfall" and the final form as a "2D Value Profile". You may get the Excel for this Pictures by clicking link above.
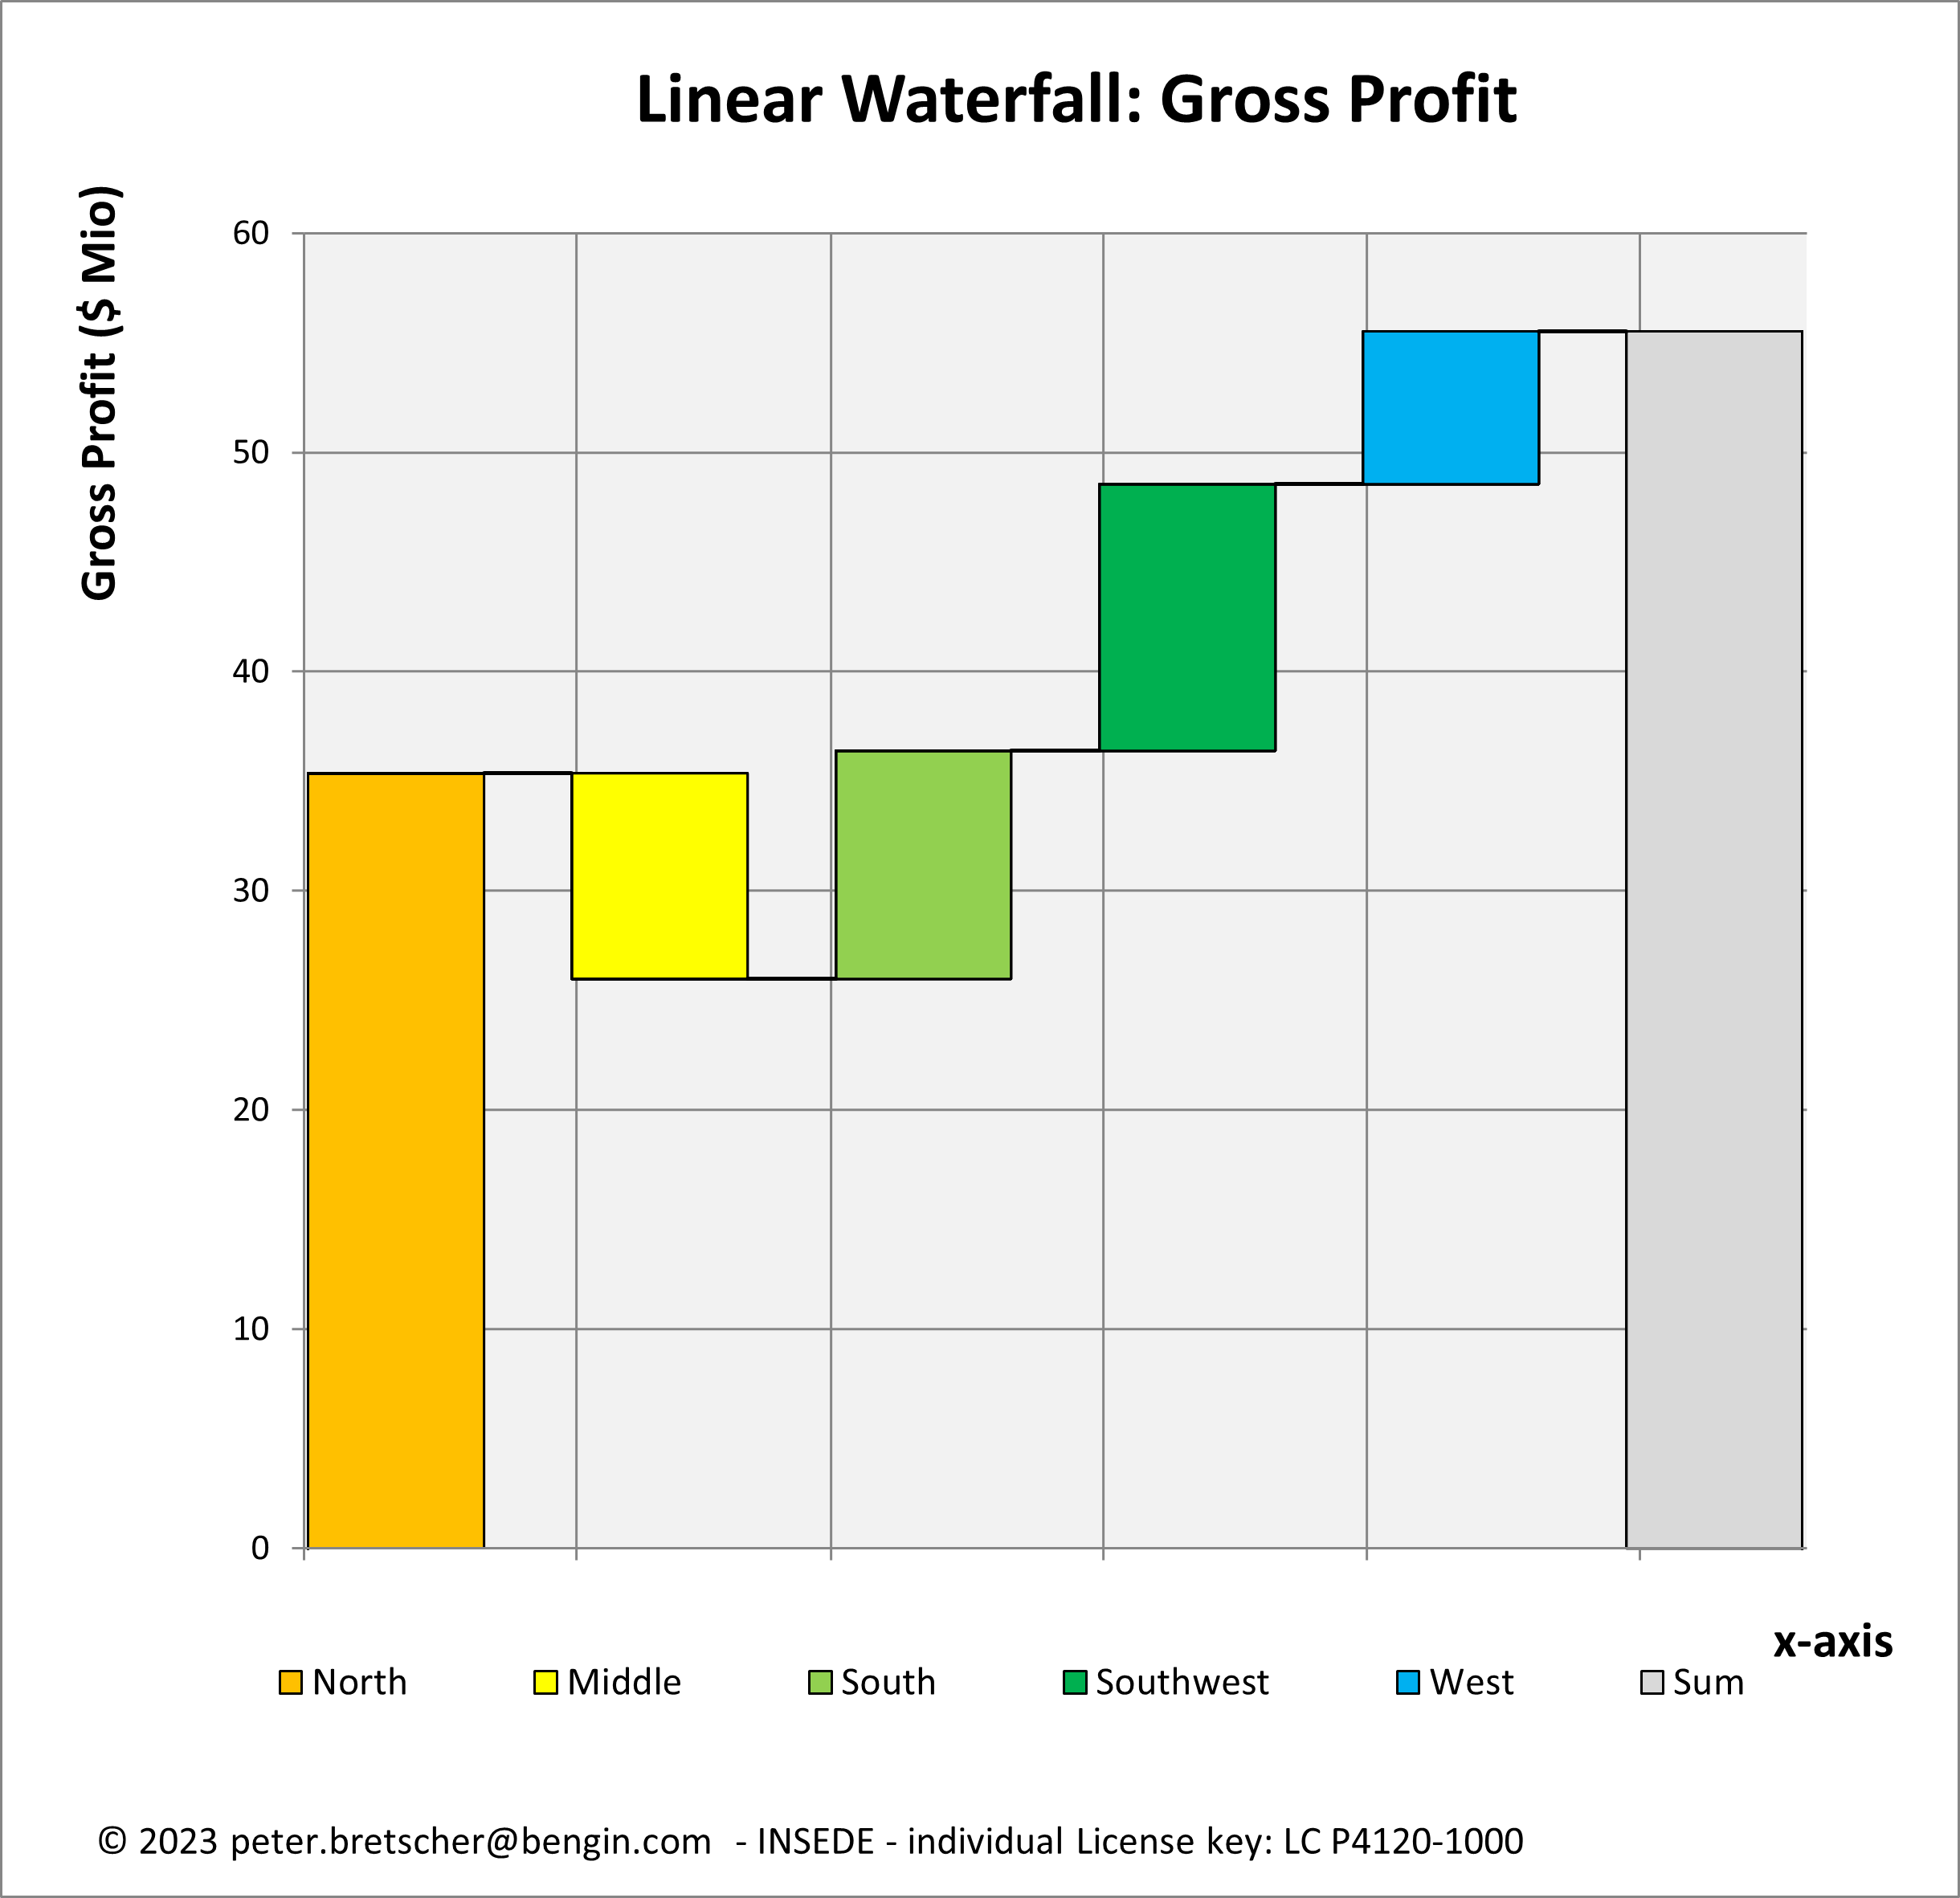
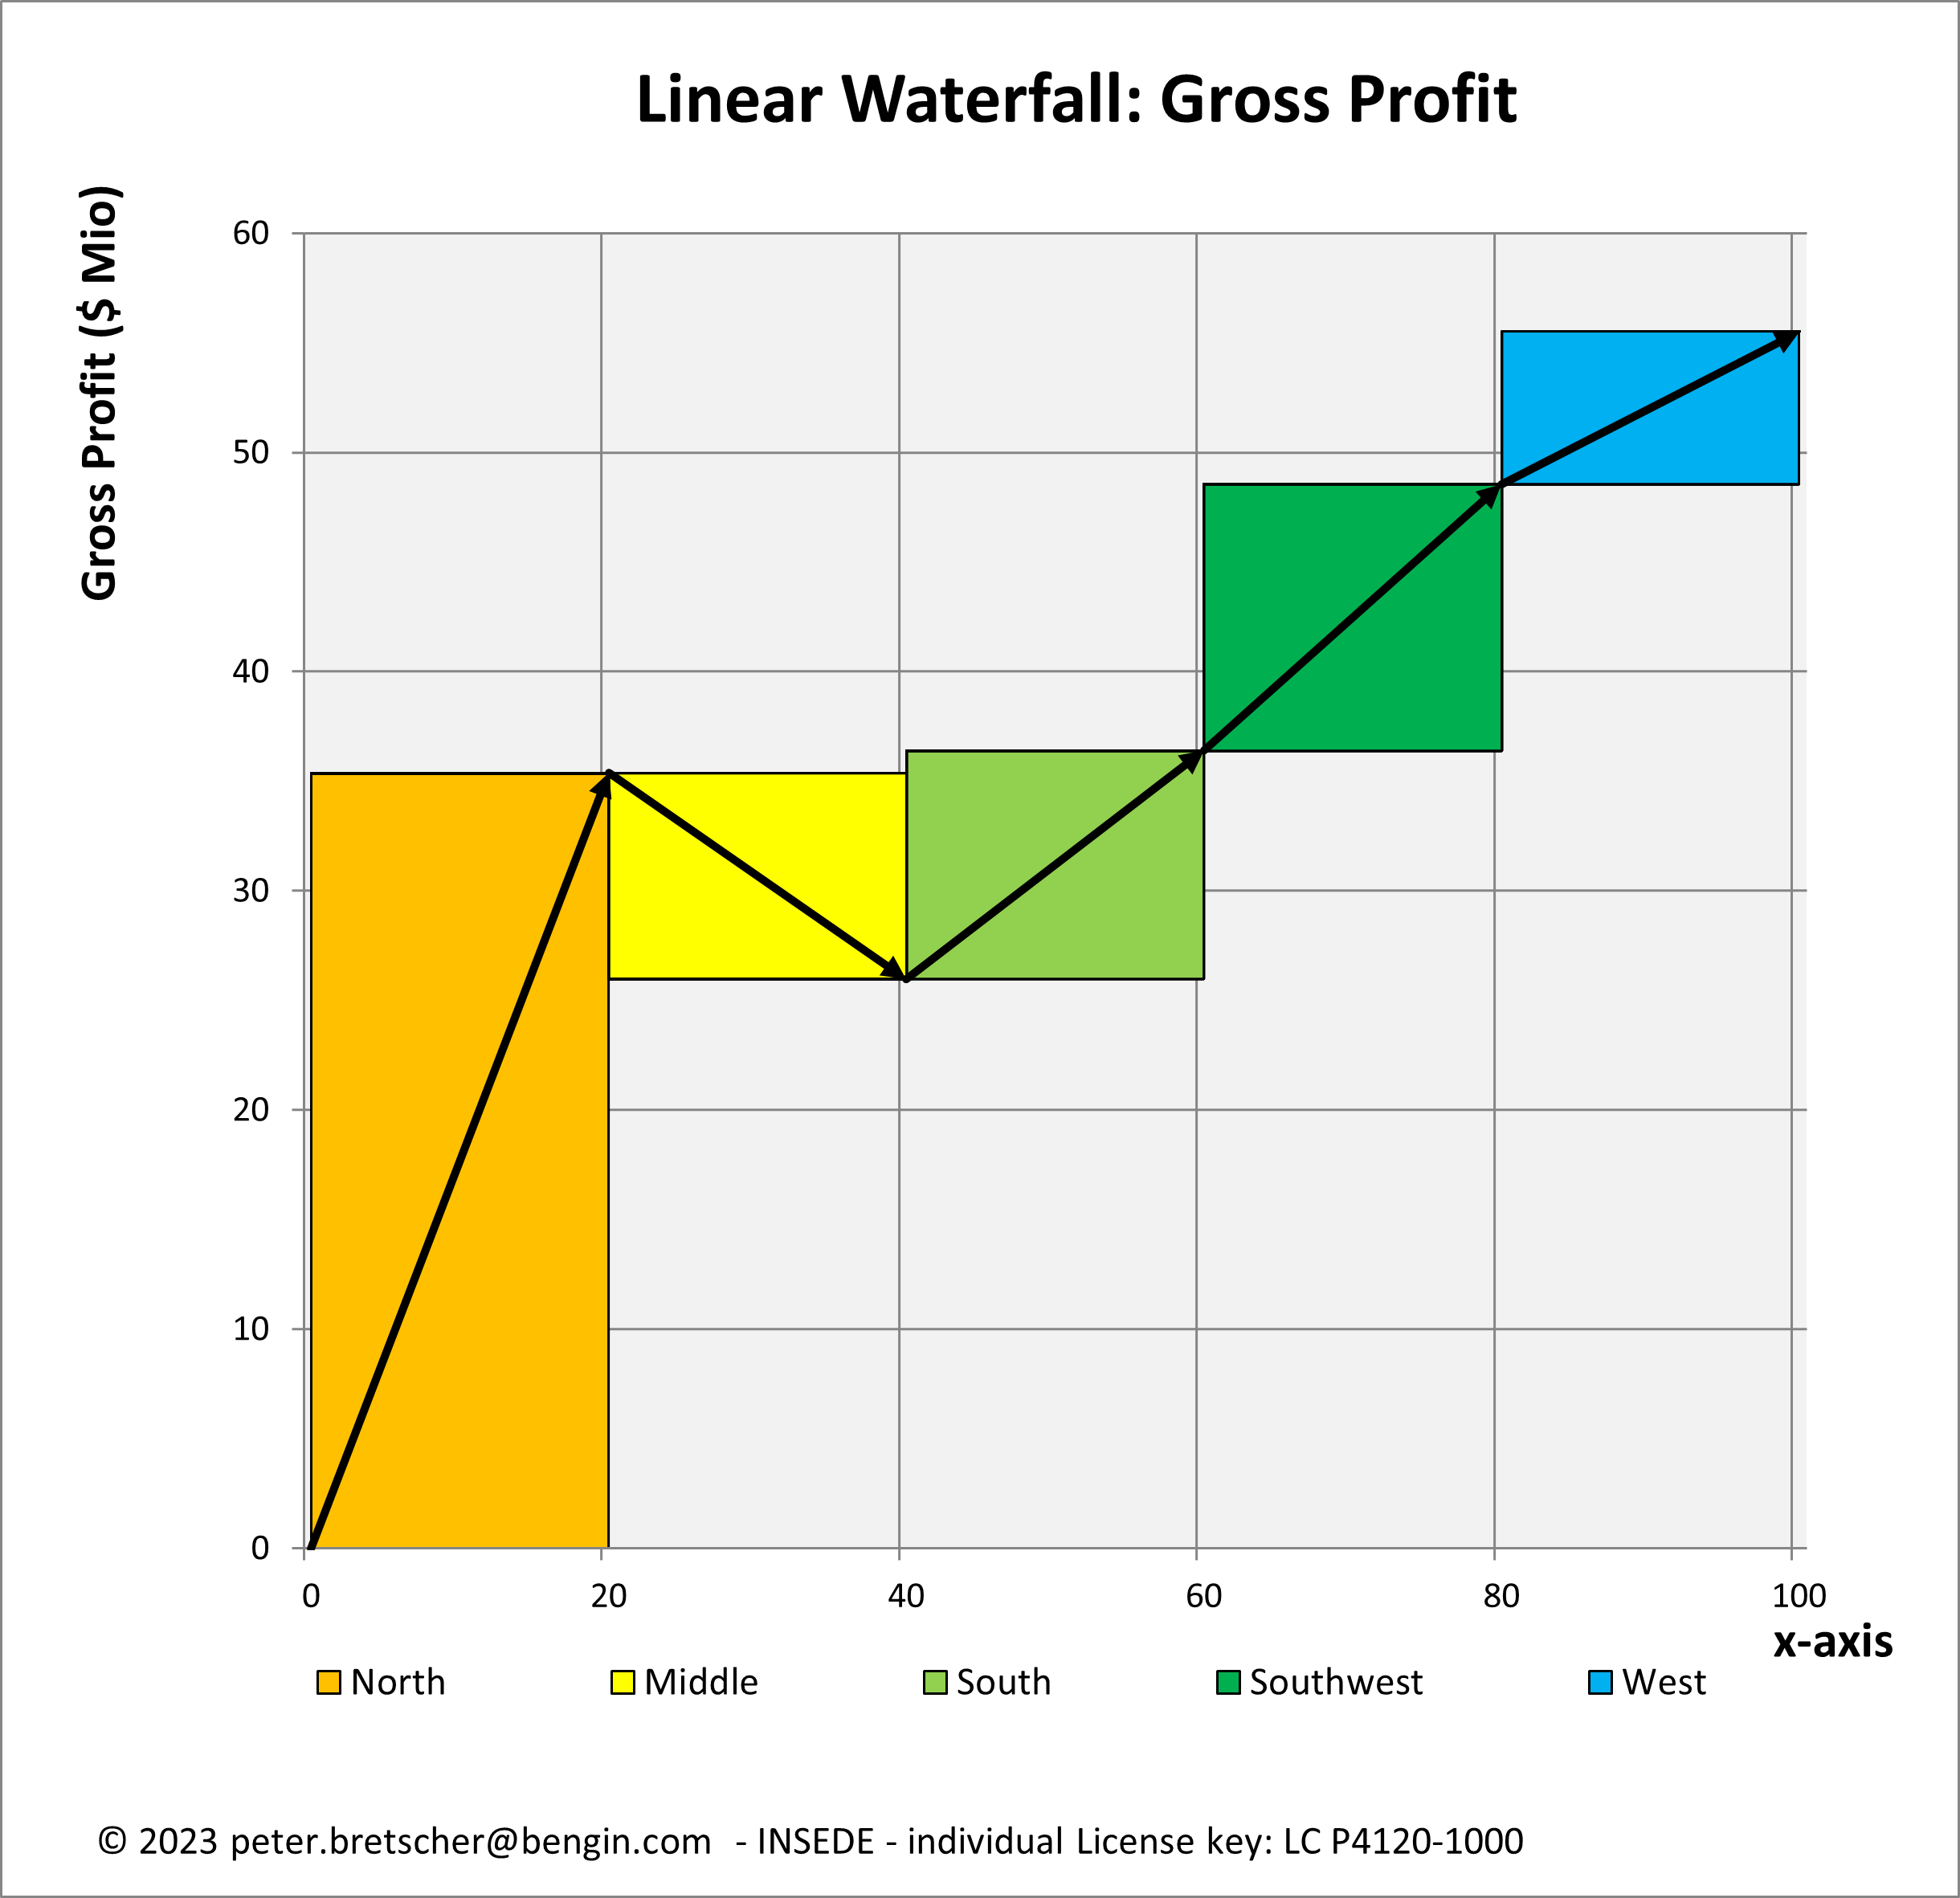
Classic Waterfall McKinsey - what's next?
--> Using the x-axis for additional information ...
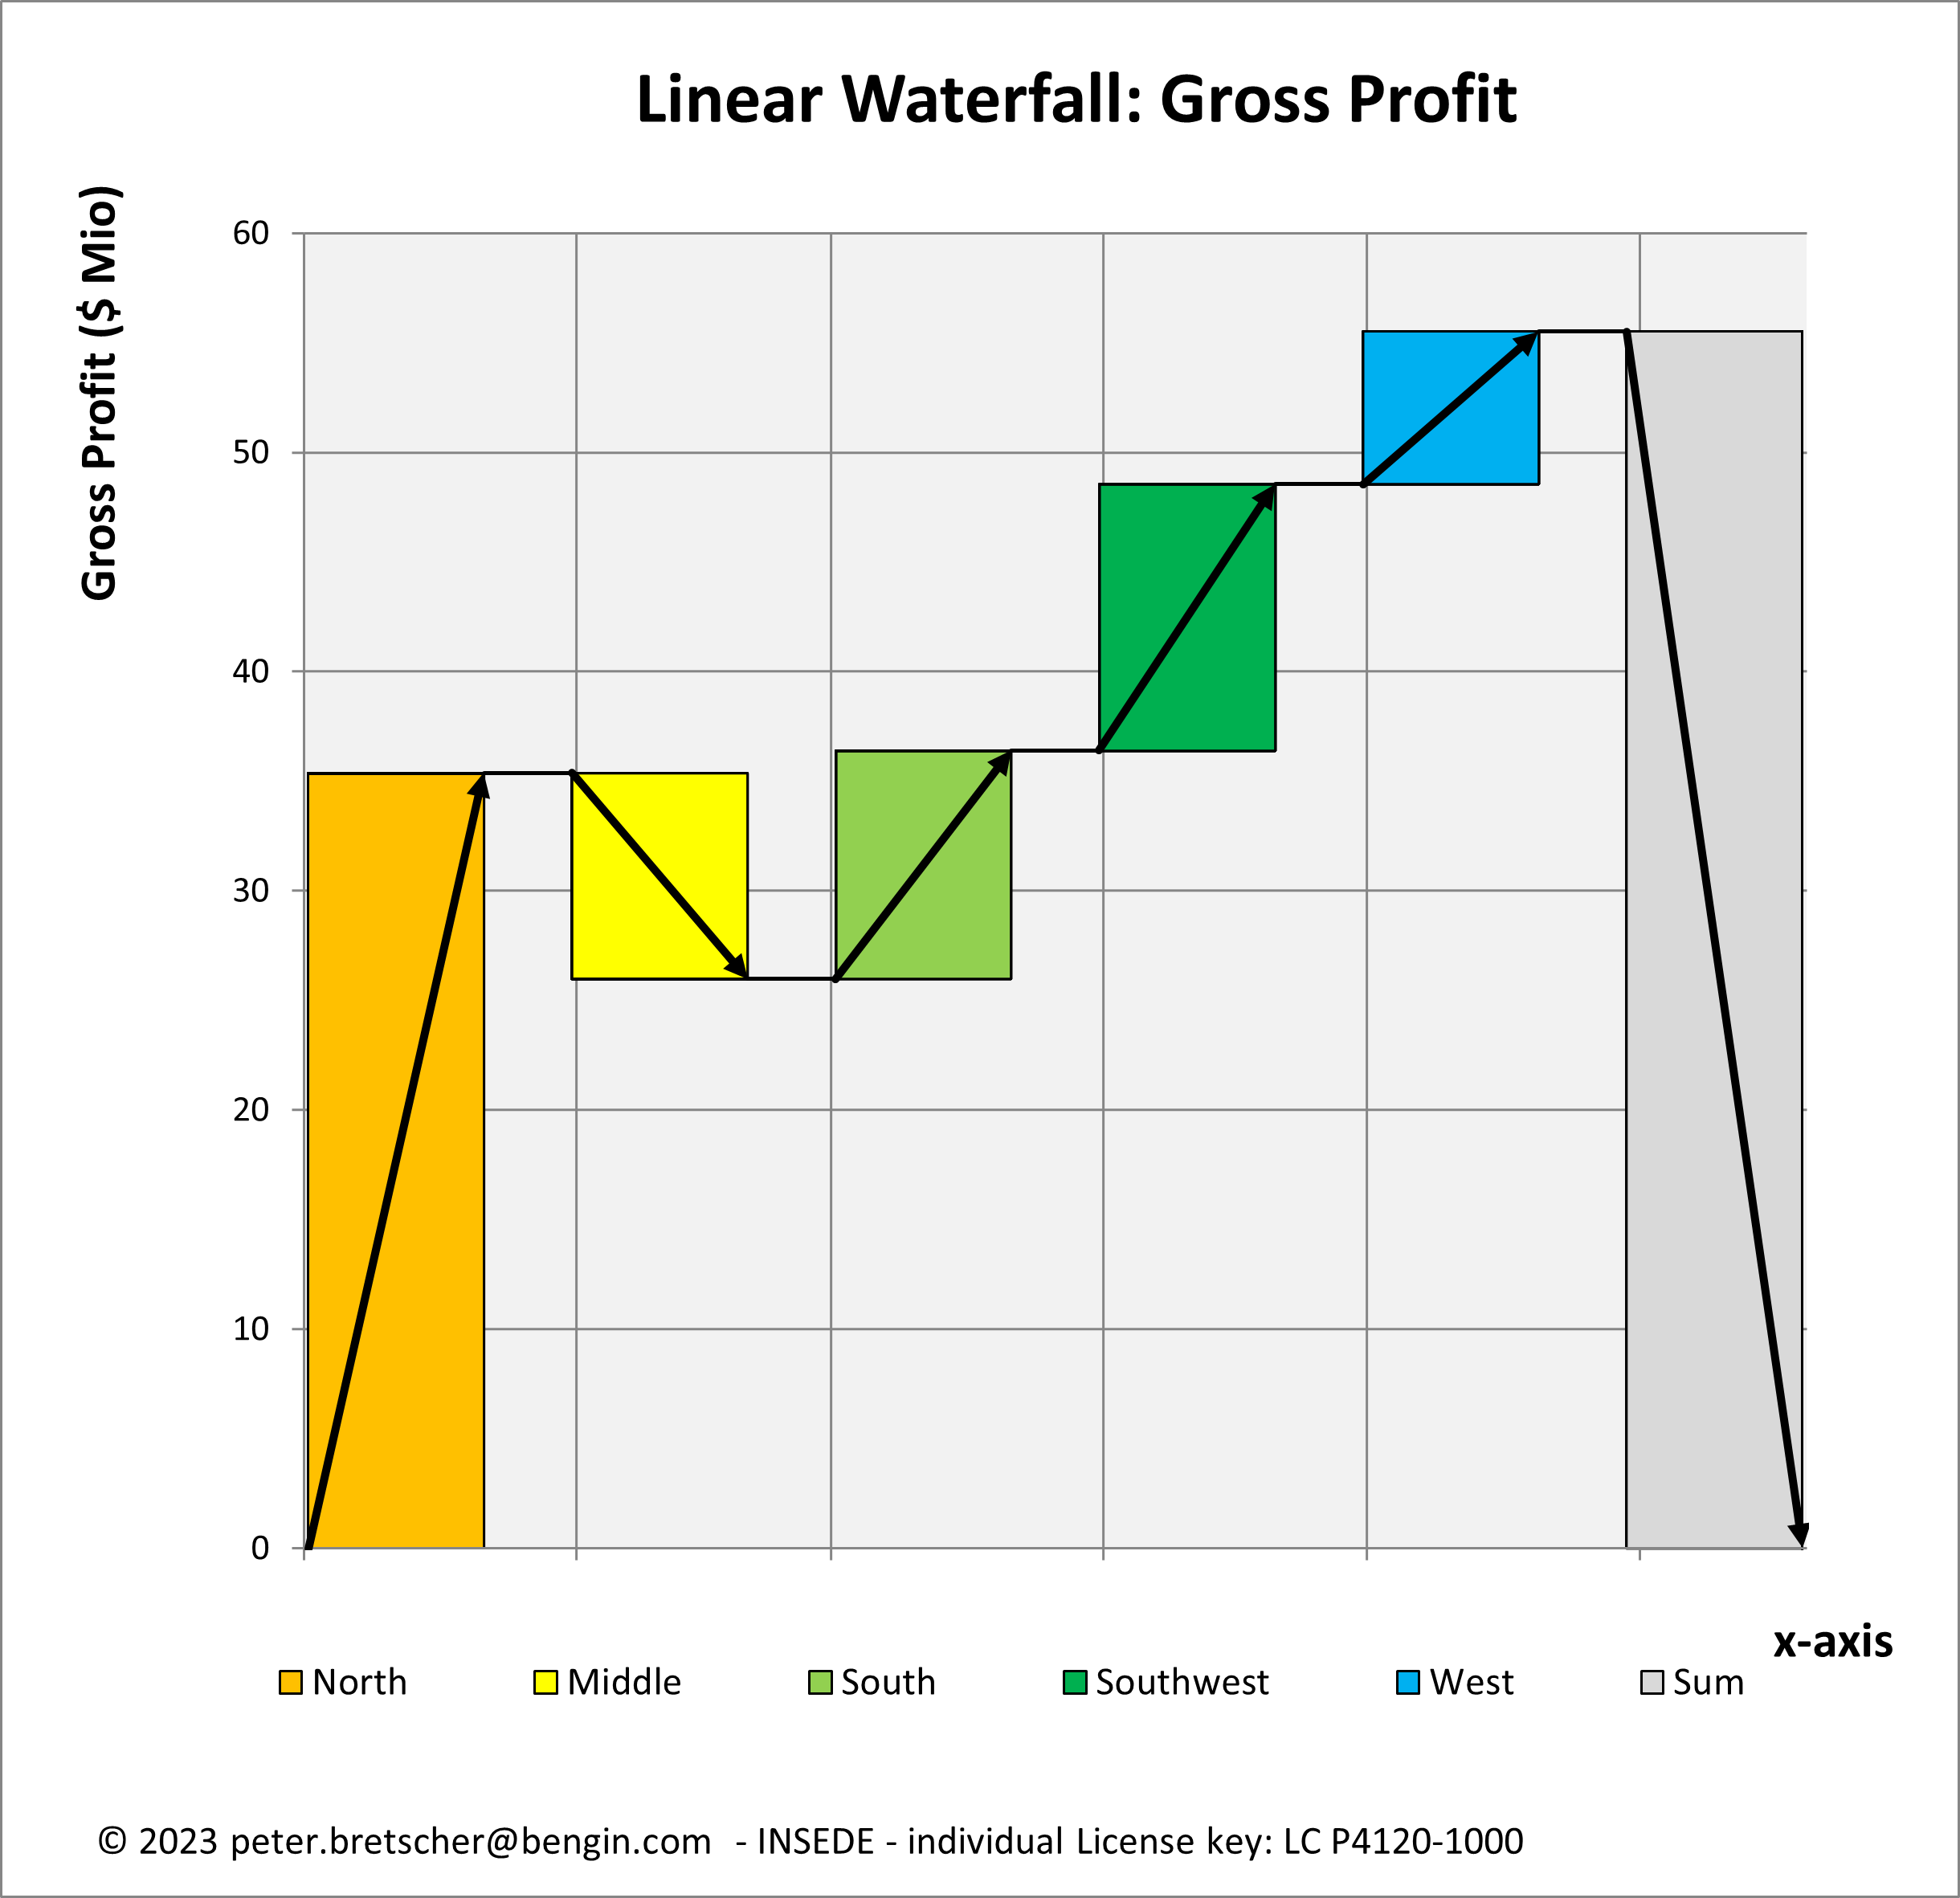
... include vectors ...
... for visualizing value generation.

No need for spaces between 'objects'.
No need for grey 'sum-column'.
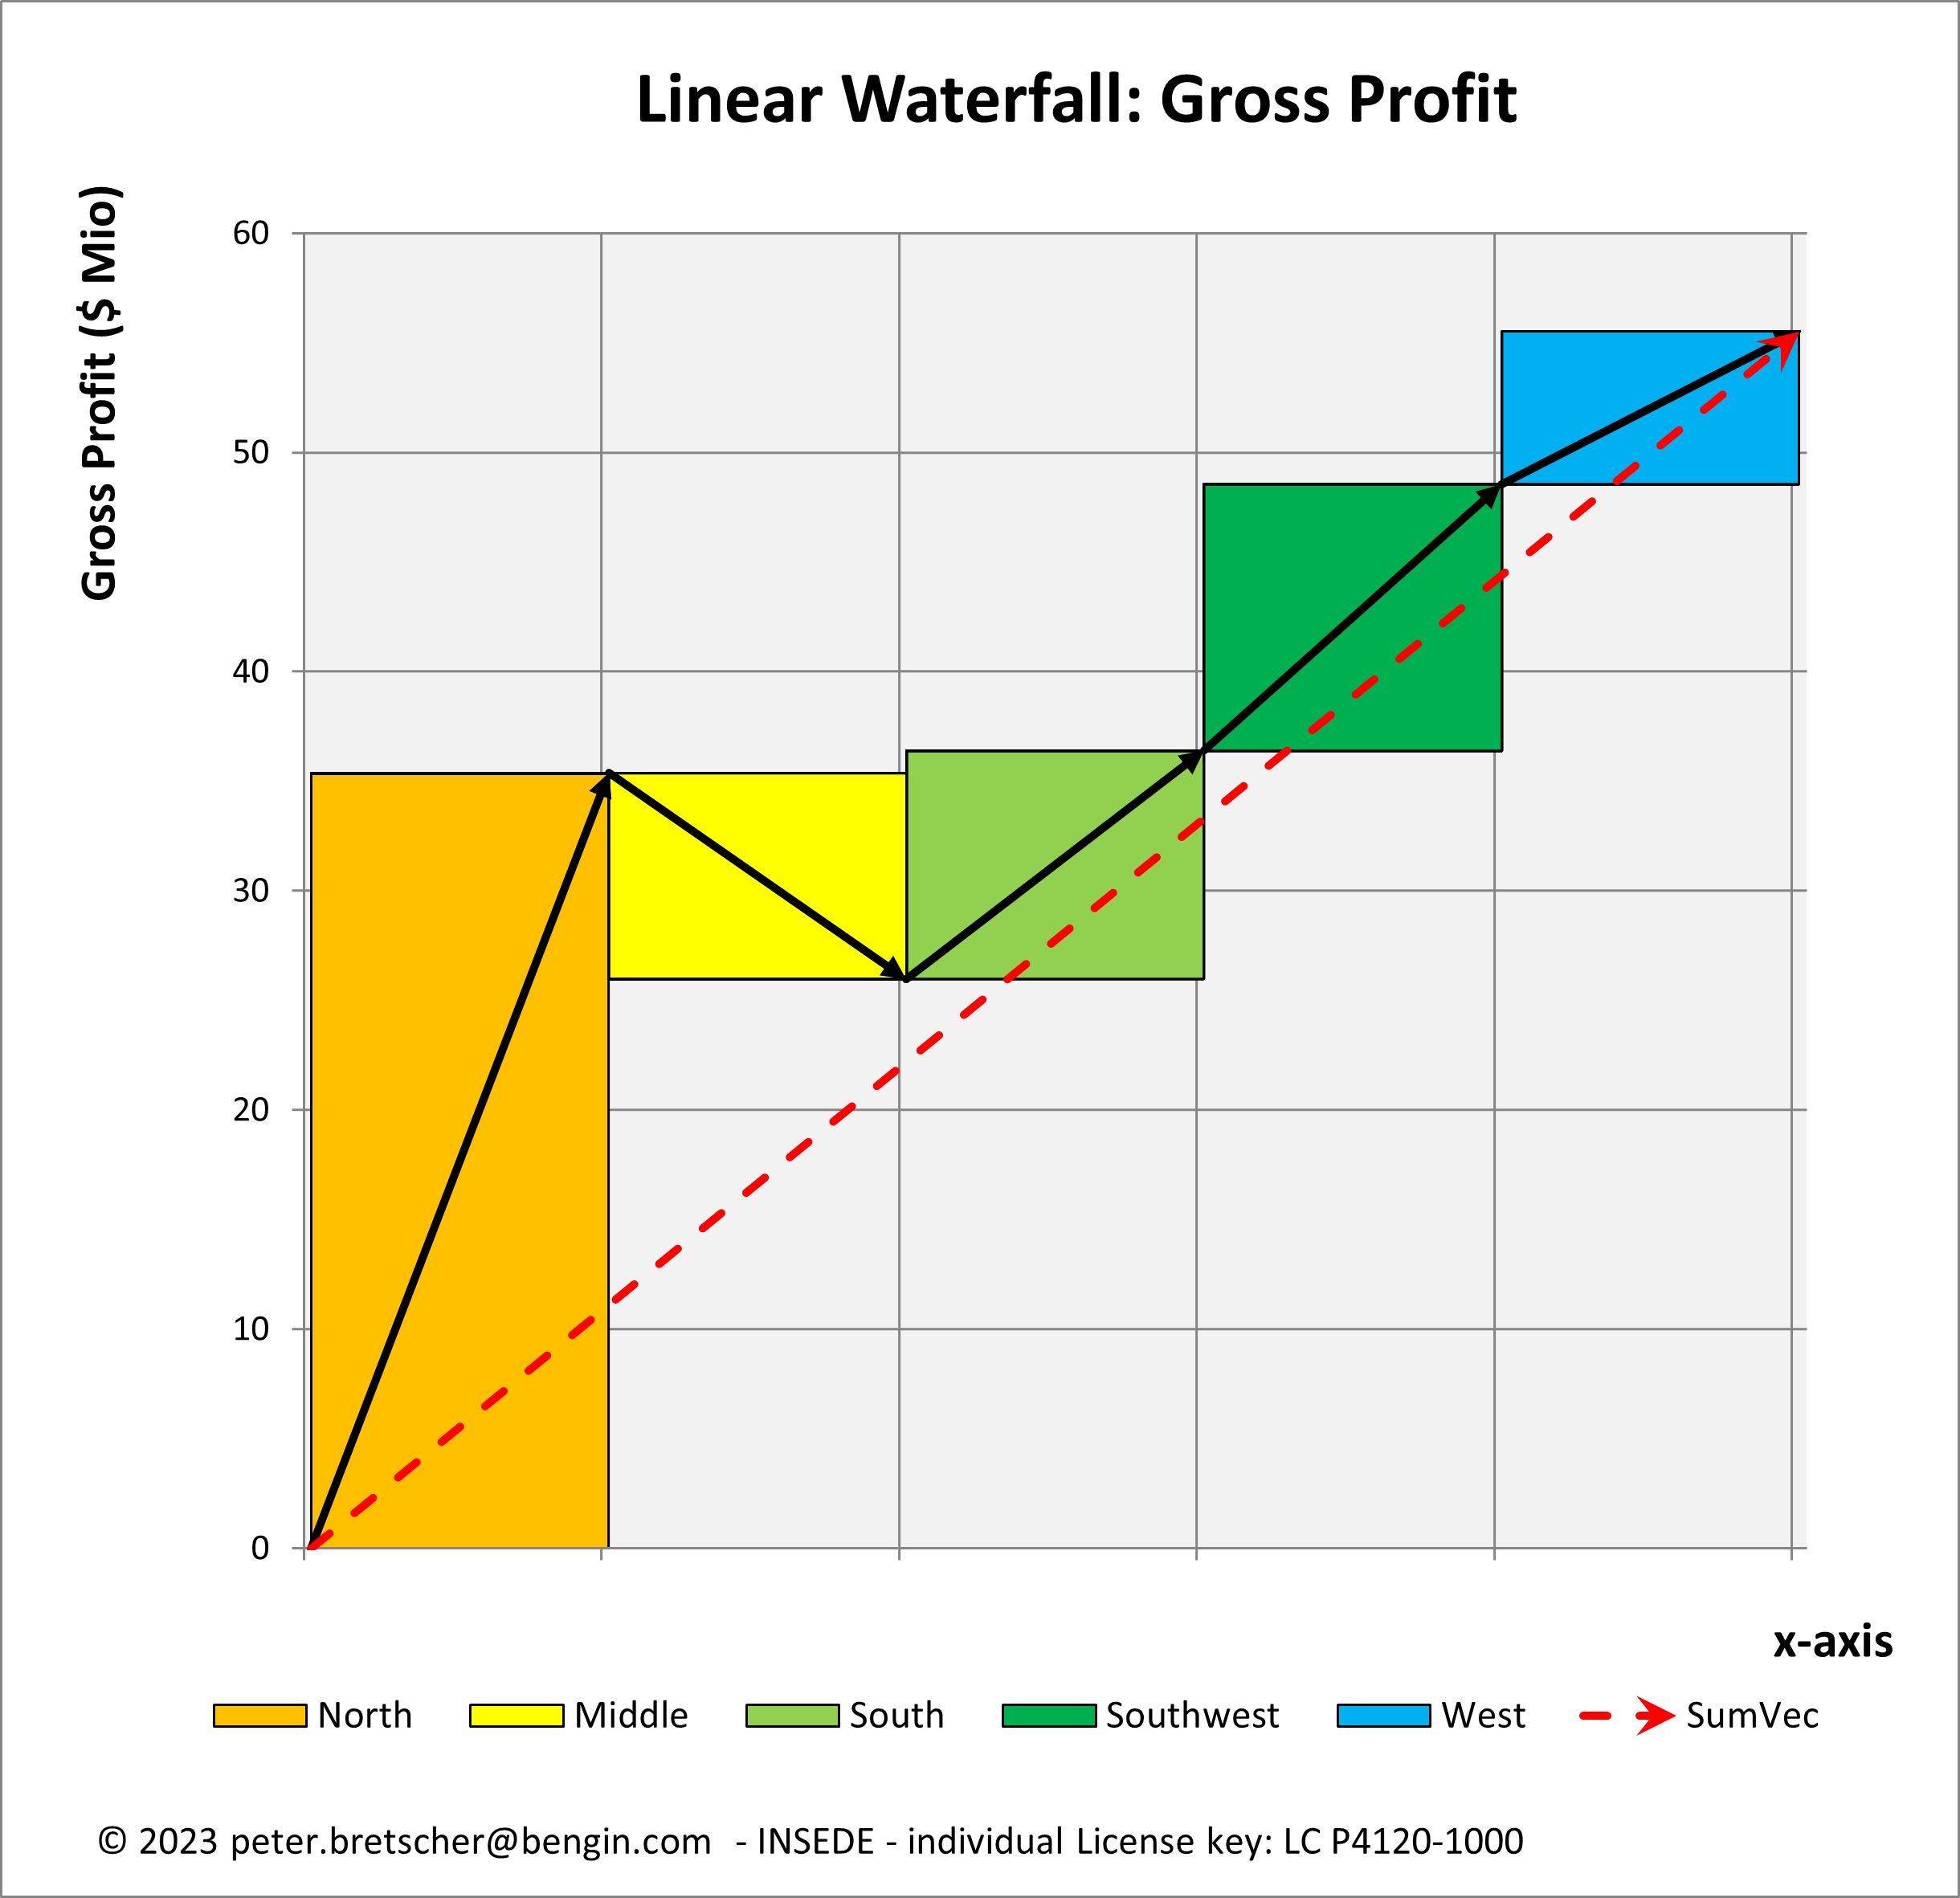
Red 'Sum-Vector' for average slope.
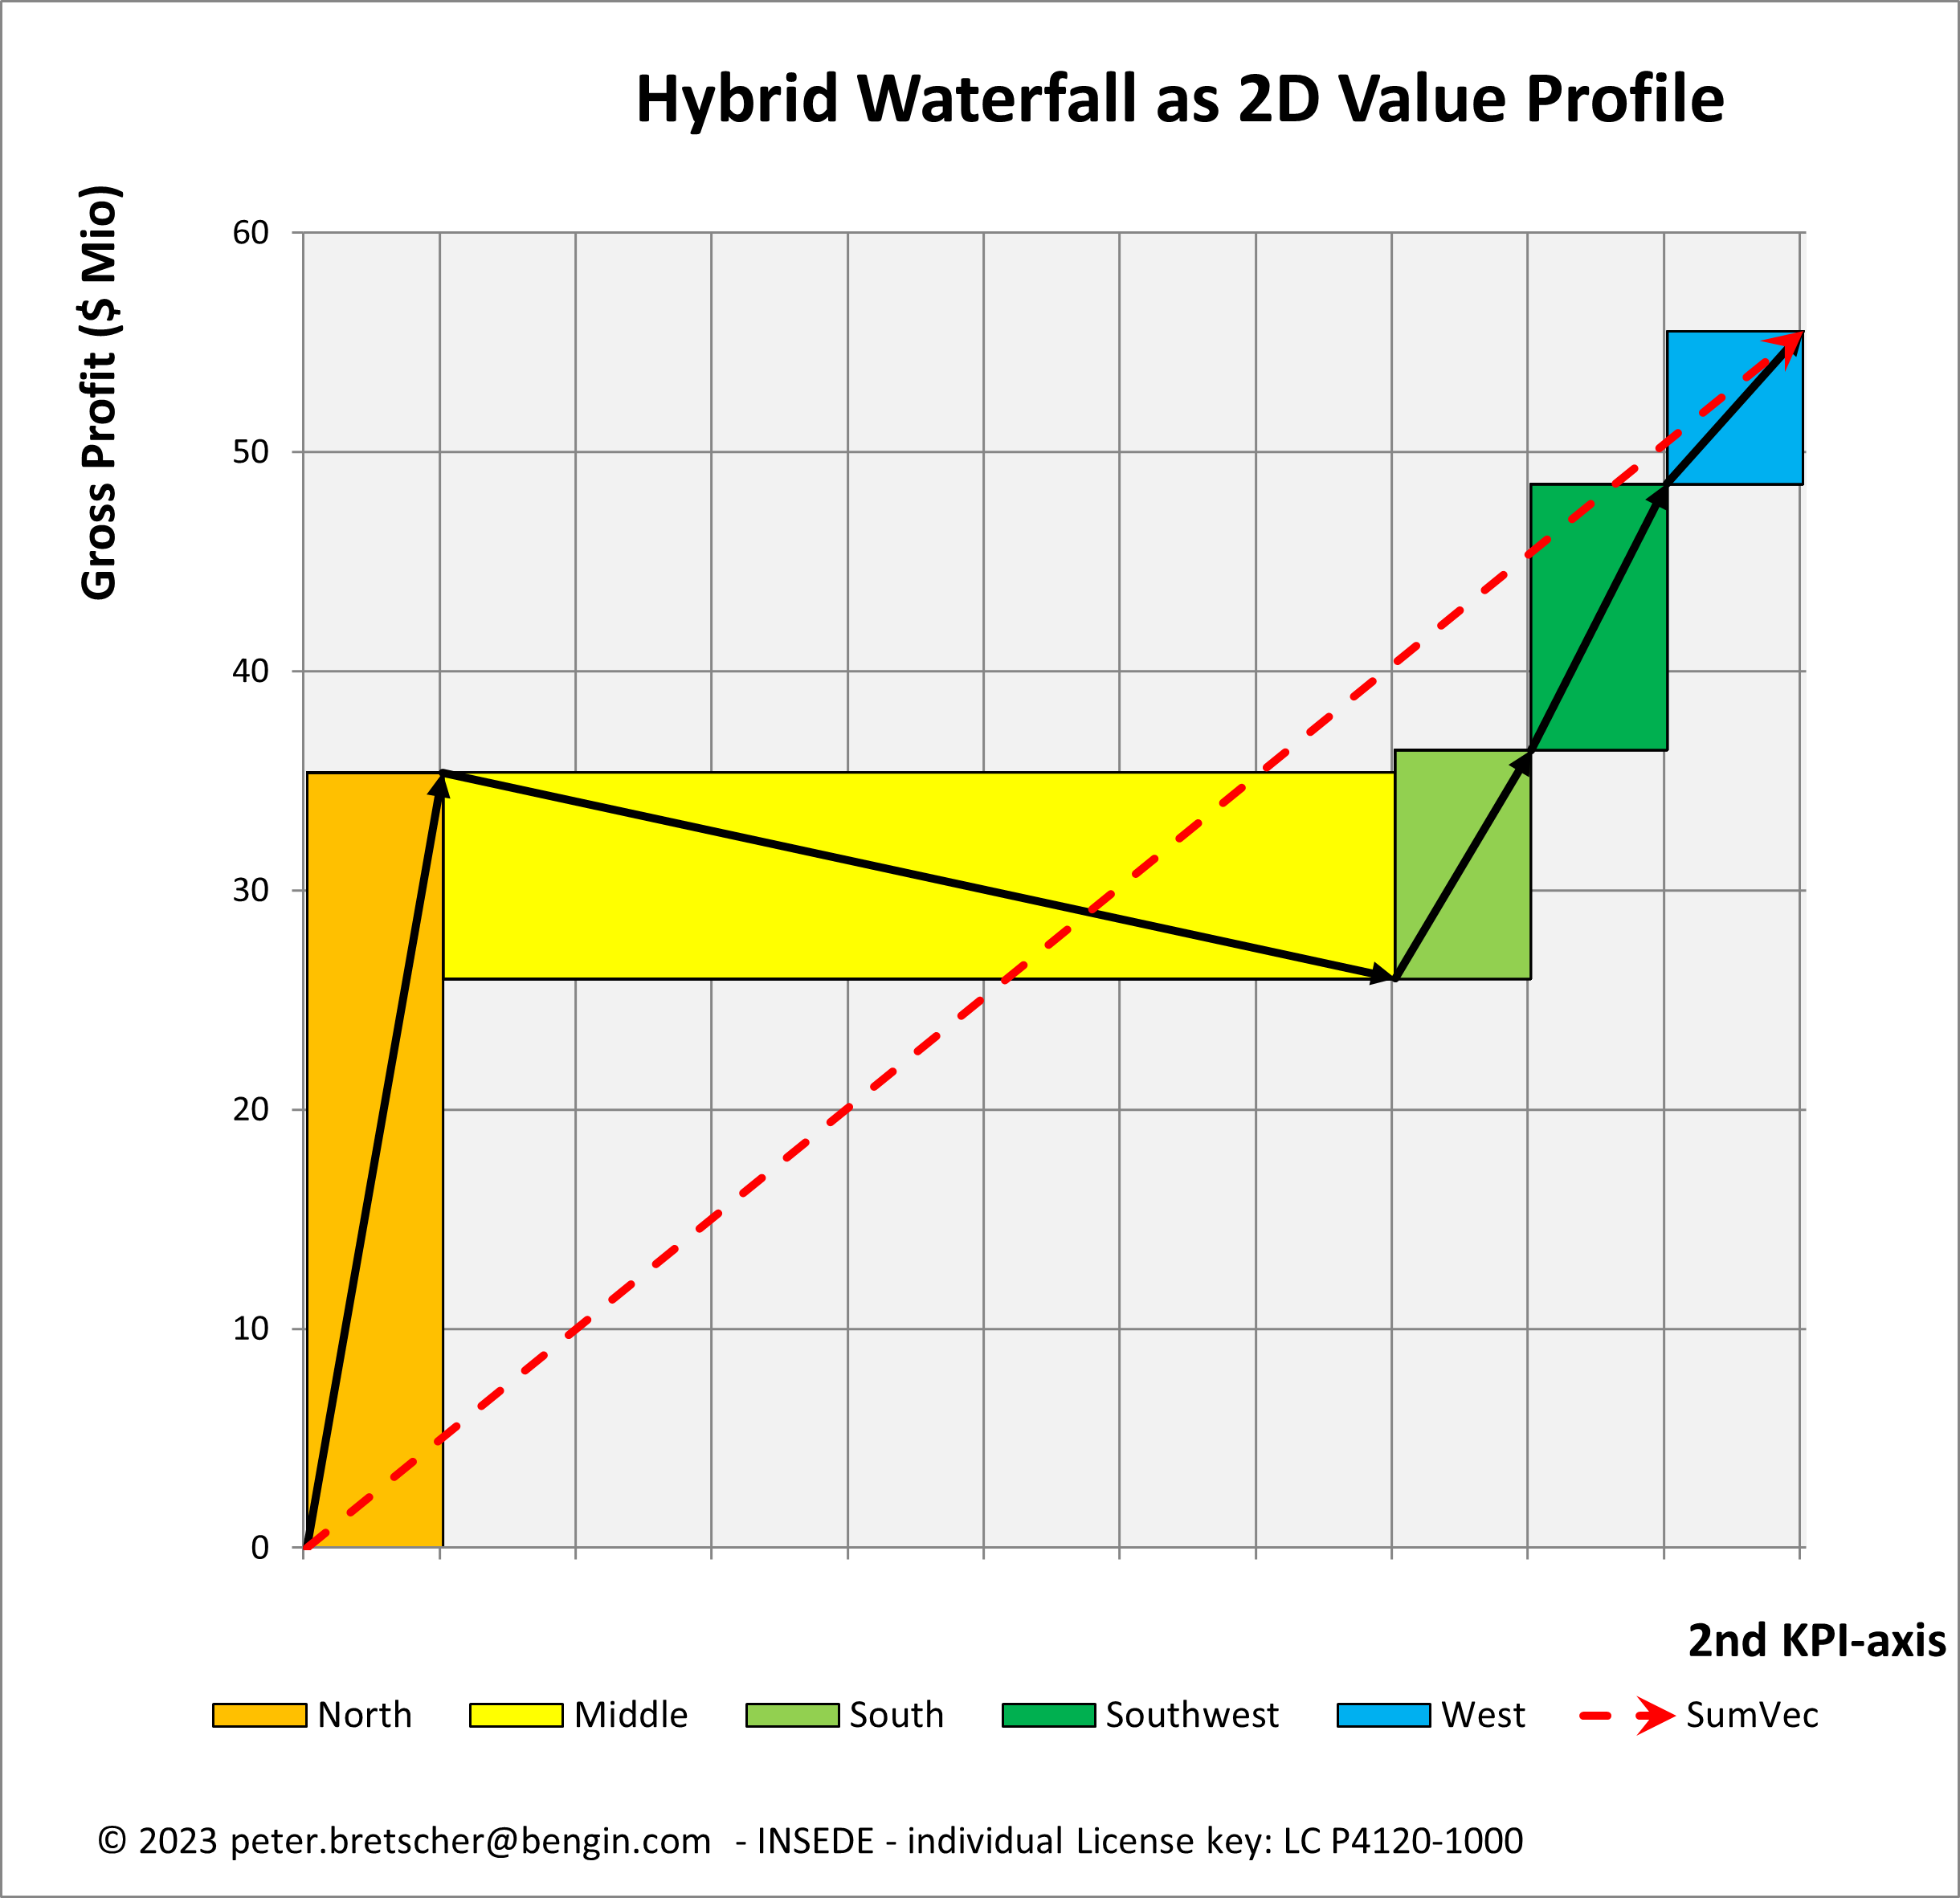
Fill in the KPIs for x-axis.
Done.
Want to show more than a single value profile?
For example, combining investment with ESG-Impact indicators - or profiles by year, enterprises...
Using vectors without underlying rectangle helps to get more transparency for comparison.
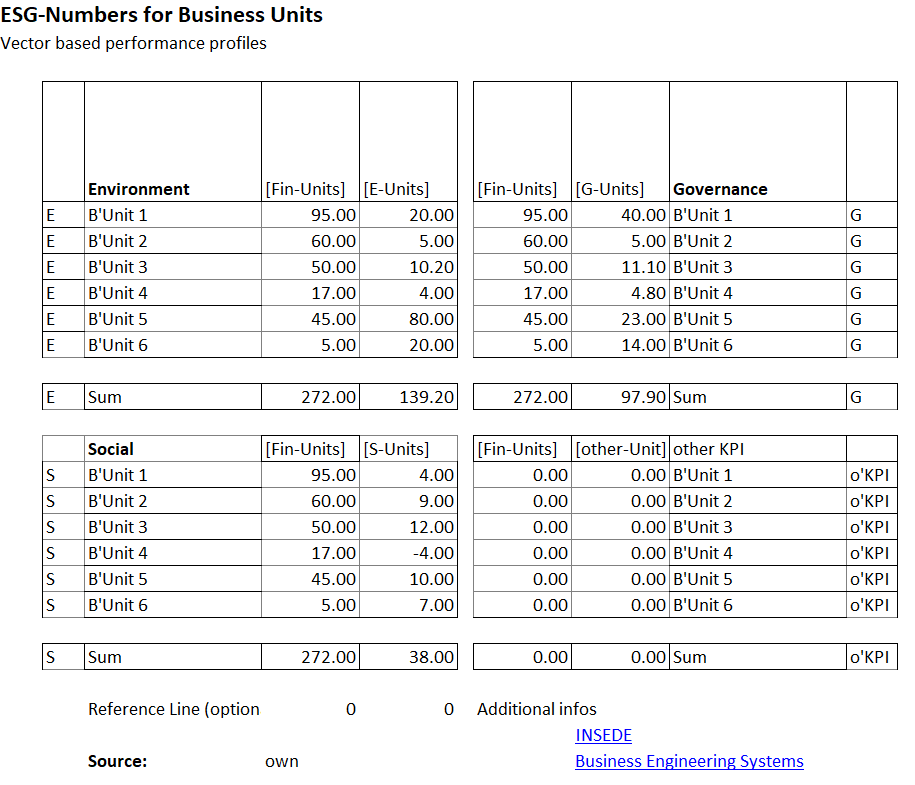
Like ESG-Numbers to find outlier?
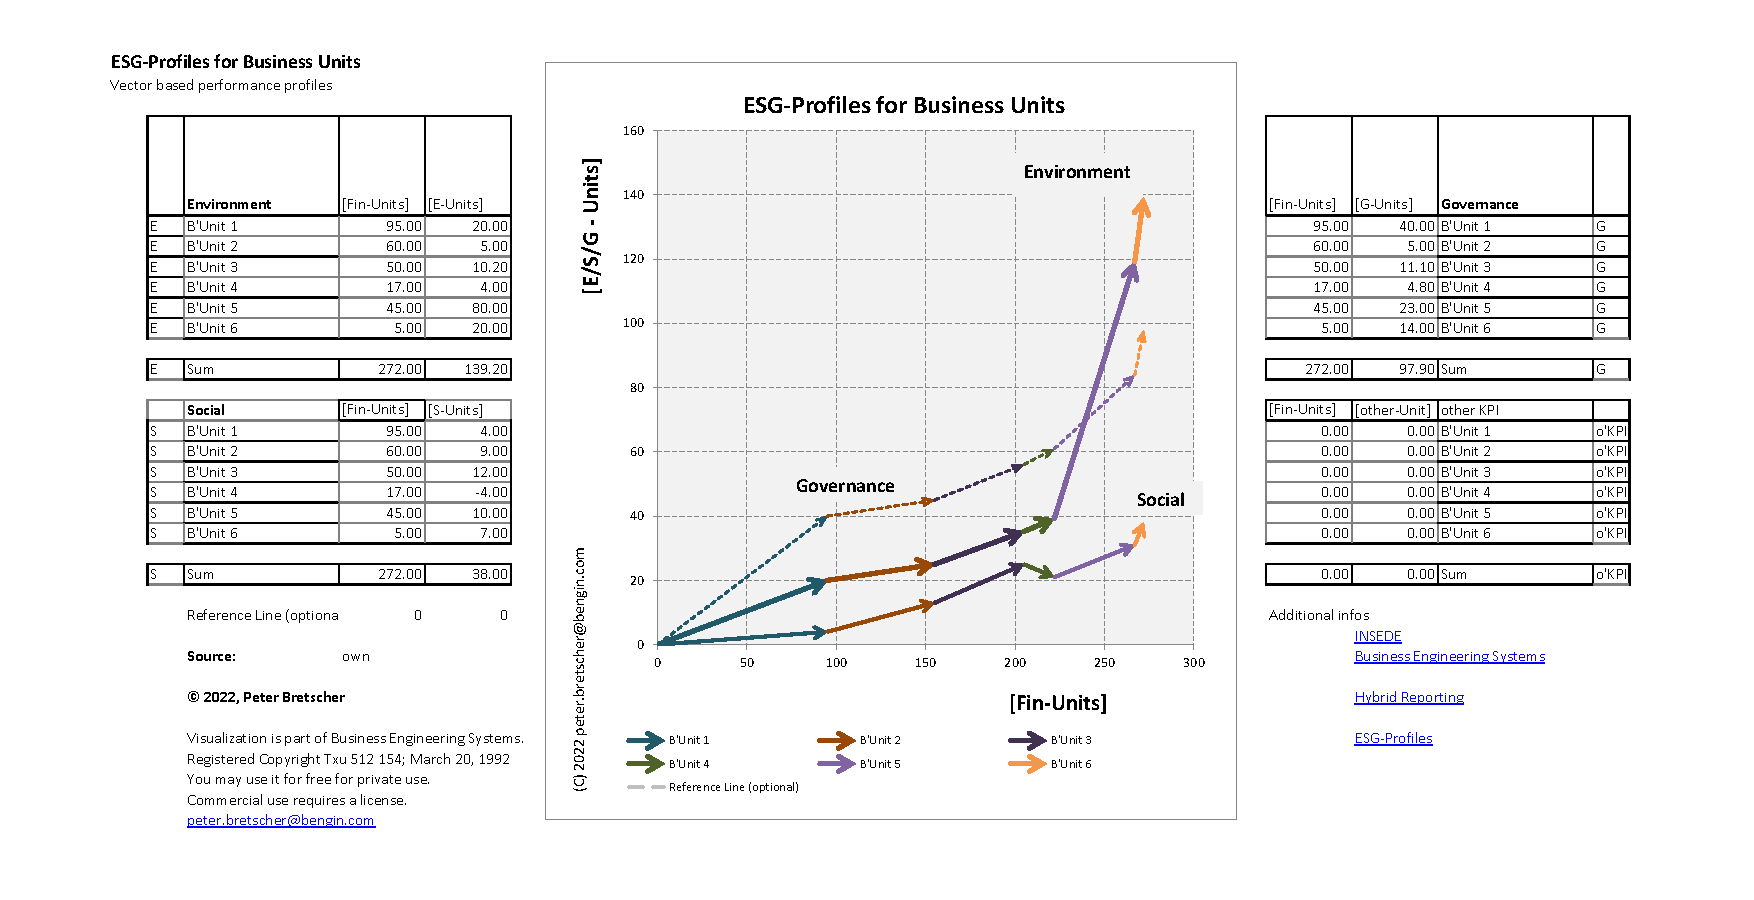
Try ESG-Profiles yourself with your specific data.
Go to page for ESG-Profiles and other options using Hybrid Metrics.
The Goal of 'Project NEMO' (New/Next Economic Model) is to enhance classic economics by
(i) including intangible assets and needs as the common (re)source of welfare and wealth and
(ii) disclosing a vector based hybrid value principle enabling monetary AND nonmonetary dimensions as a compound/hybrid measure.