Magic Profiles©:
It's not the result alone that counts - it's how to get it too.
Enhance Transparency using Hybrid Metrics and Hybrid Reporting

Classic Magic Quadrant - two results with elements
In the world of business and systems analysis, it's crucial to look not only at the end result, but also at the process that led to that outcome.
Tools such as Gartner's 'Magic Quadrant' provide a visual representation of the study results, making it possible to see at a glance which products or services are considered leading or challenging.
The 'Magic Profile' from the 'Business Engineering Systems' goes one step further by highlighting the different elements and their contribution to the overall result. This type of visualization can be extremely useful for understanding the underlying factors and dynamics that lead to the end results.
It makes it possible to quickly grasp complex data and relationships and promotes a deeper understanding of the strengths and weaknesses of a system or organization.
This, in turn, can lead to more informed decisions, more targeted improvement actions, and ultimately a more efficient and effective business strategy.
Explore Magic Quadrants when considering technology investments — it’s not always about focusing solely on market leaders.
Sometimes niche providers align and suceed in specific properties (Elements of result).
Go to: Gartner.com
Magic-Profile is part of 'Project NEMO' (New/Next Economic Model) and 'Business Engineering Systems' (tools for smarter economy) - registered Copyright TXu 512 154 - commercial use needs adequate license - trials and private use is free (no derivatives) - want to know more? -> e-mail: peter.bretscher@bengin.com
Get enhanced insights - see the elements of the sum too.
The original and two types of profiles to show the elements of the study result (= red vector).

Classic Magic Quadrant
shows where
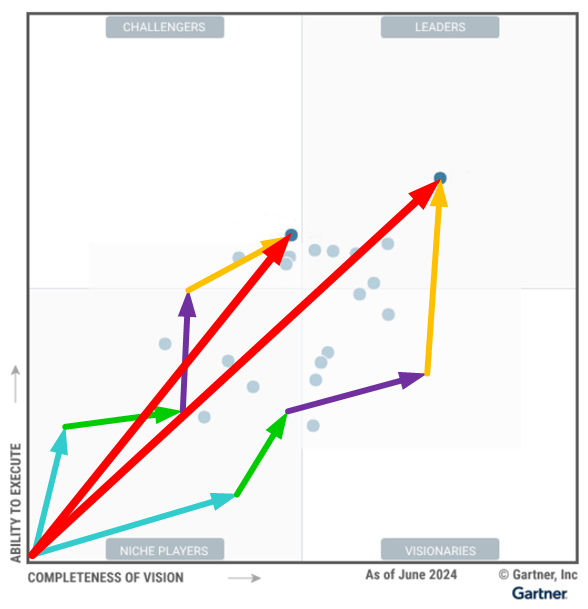
Magic Profile with vectors for elements
shows how to get there (V1)
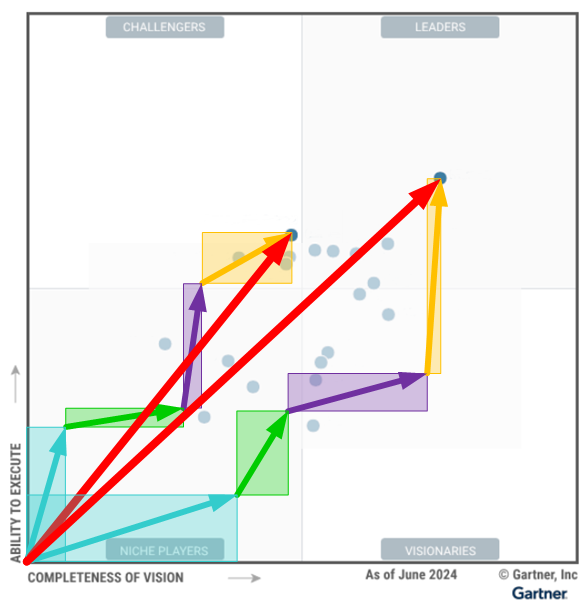
Magic Profile with 'stairsteps' for elements
shows how to get there (V2)
Other Options for insights using Hybrid Metrics.
Visualizing is key for better transfer of insights to others' understanding.
Below some solutions from the "measuring and visualizing multidimensional metrics" part. Download and try Excel templates. No registration needed.
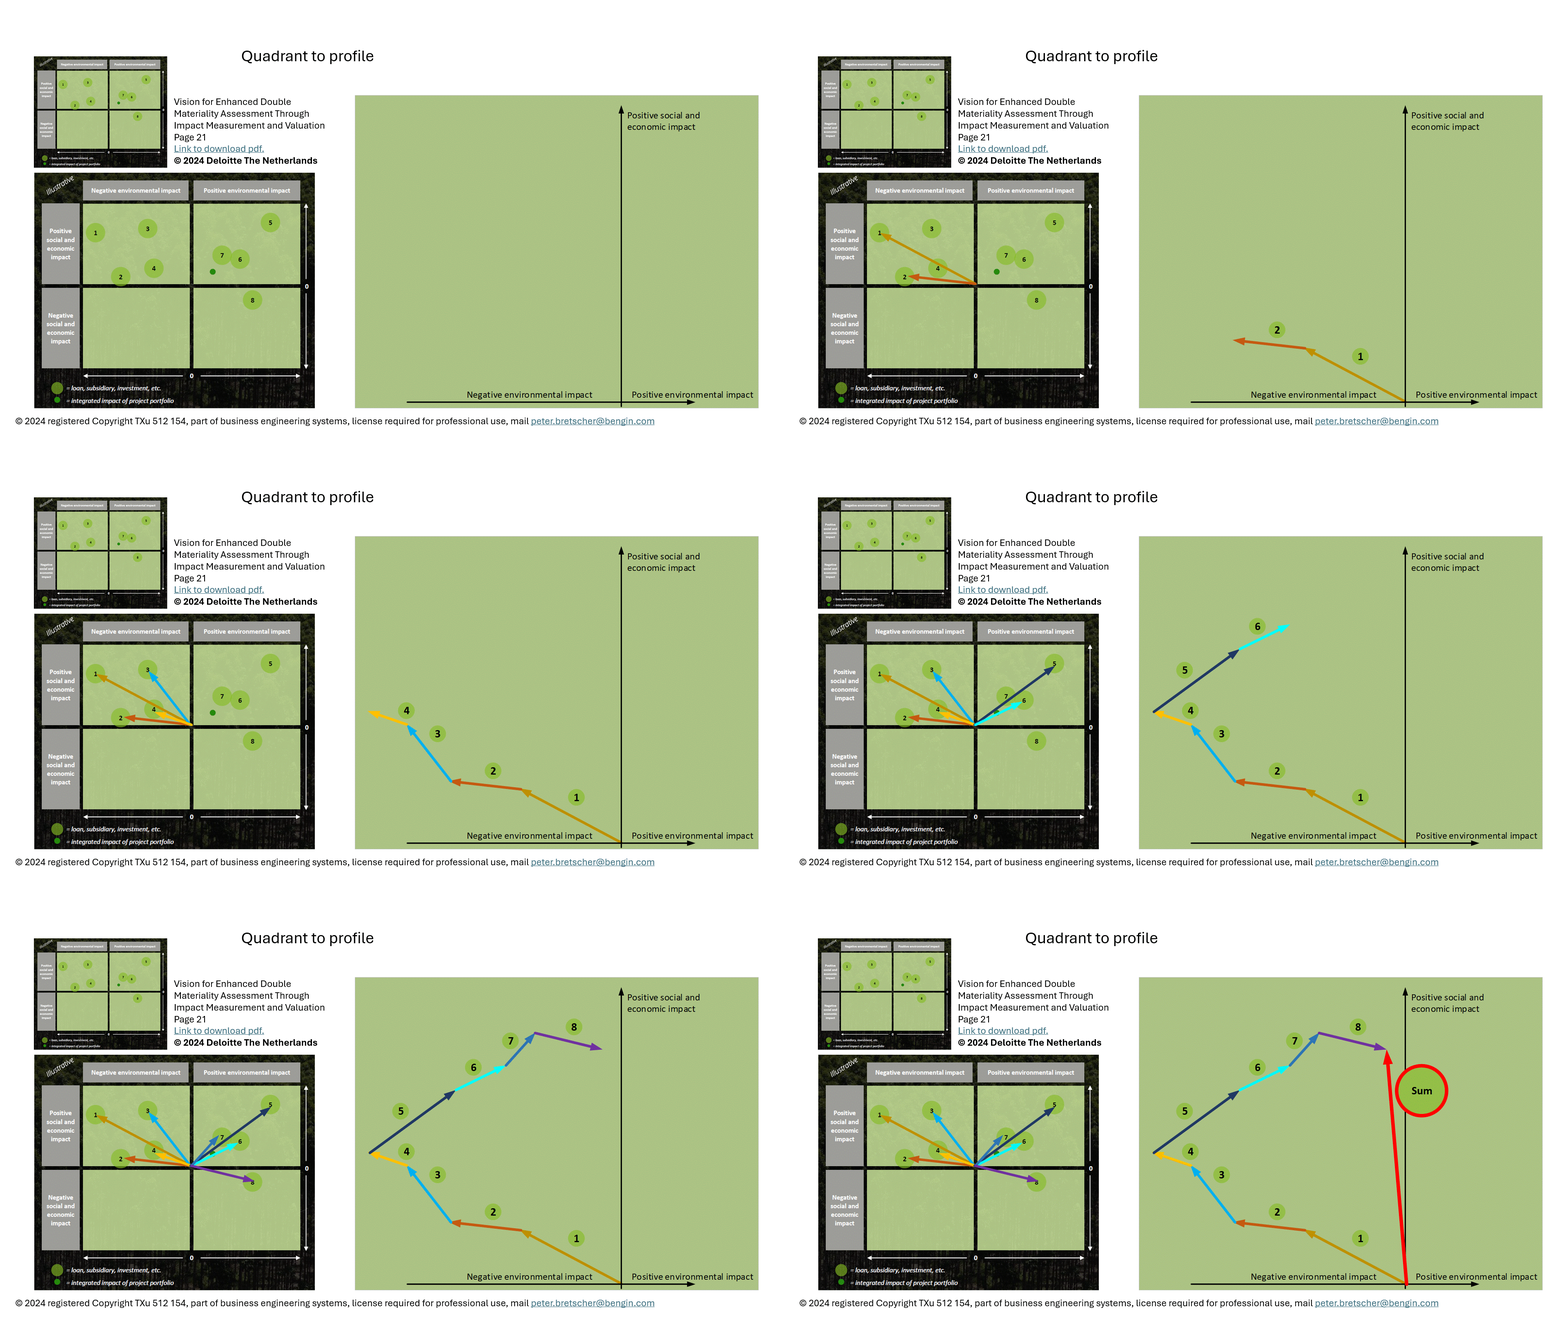
Another application of Magic Profile.
Go to: Deloitte & Impact Profile
Click picture to enlarge.
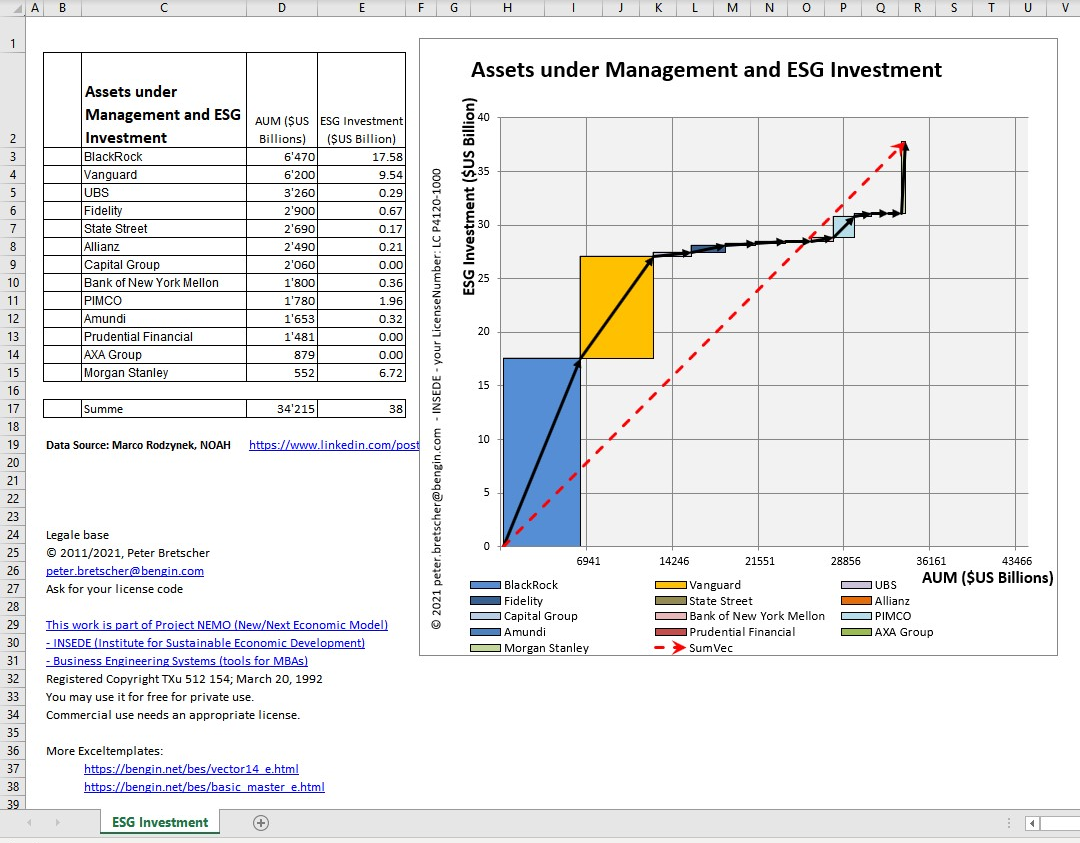
Hybrid Metrics in Boxes.
Download Excel

Numbers visualized in a profile -
Download Excel Template here
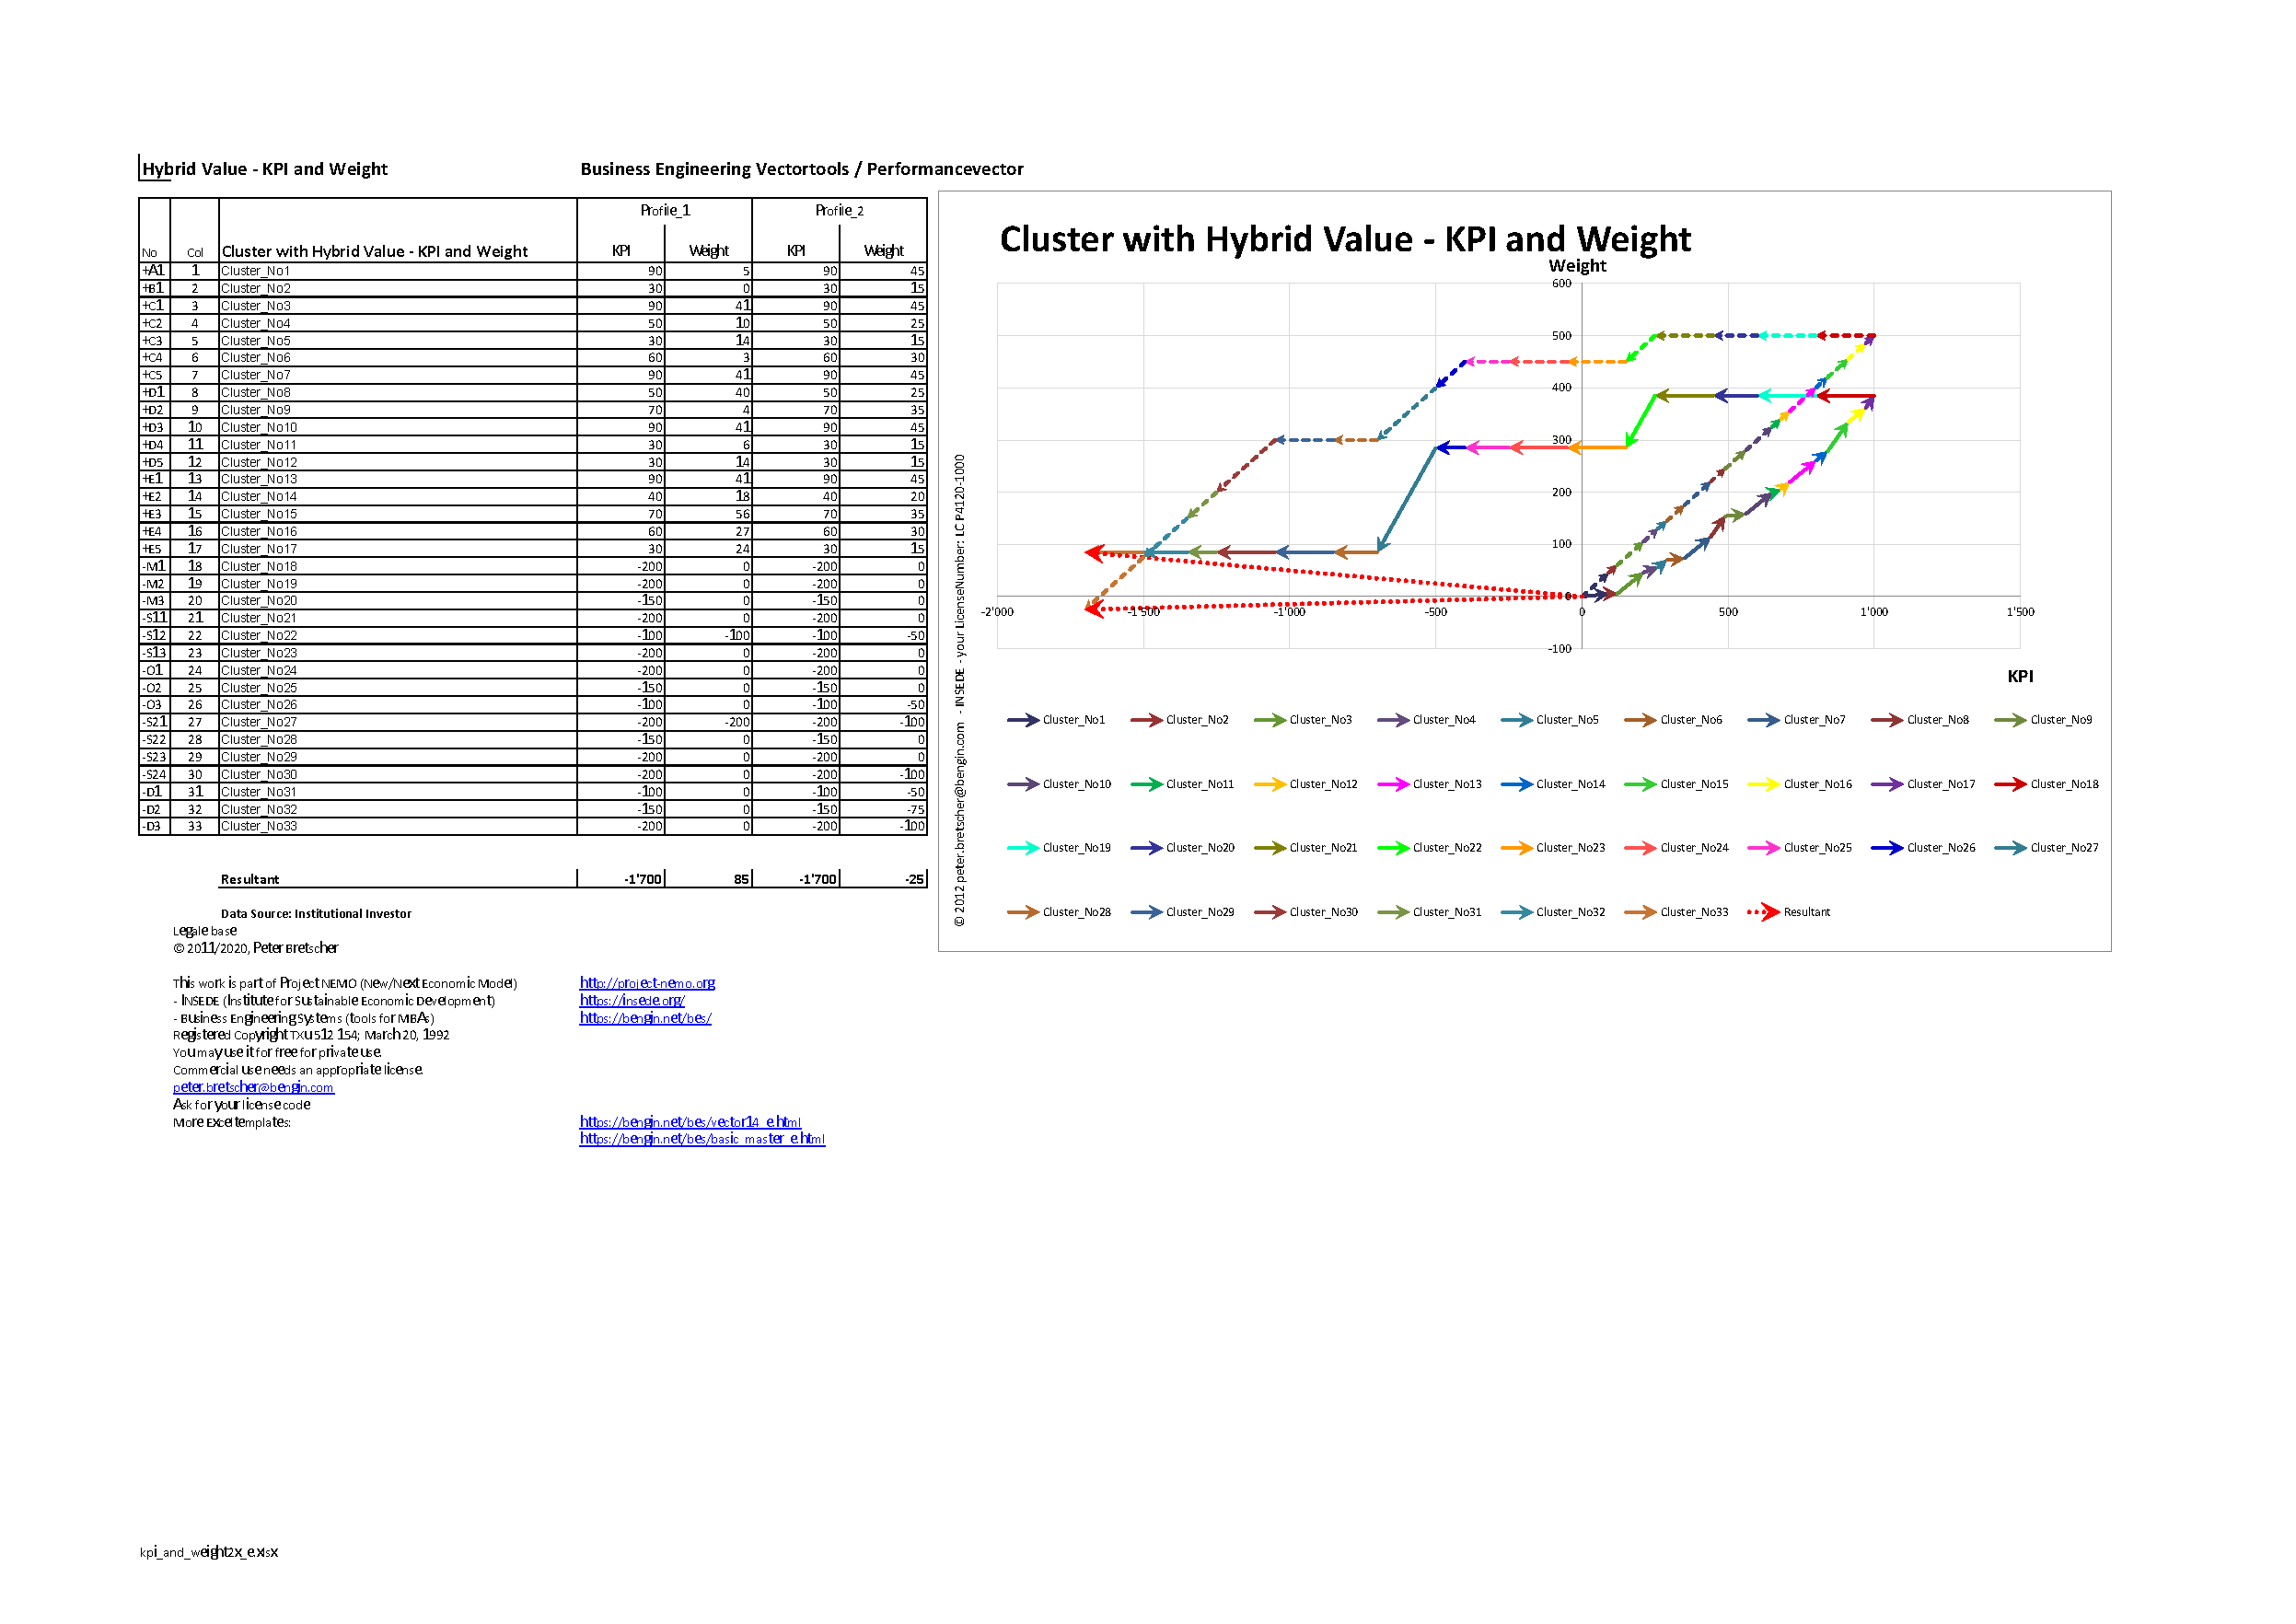
Want to compare two profiles? Download template here
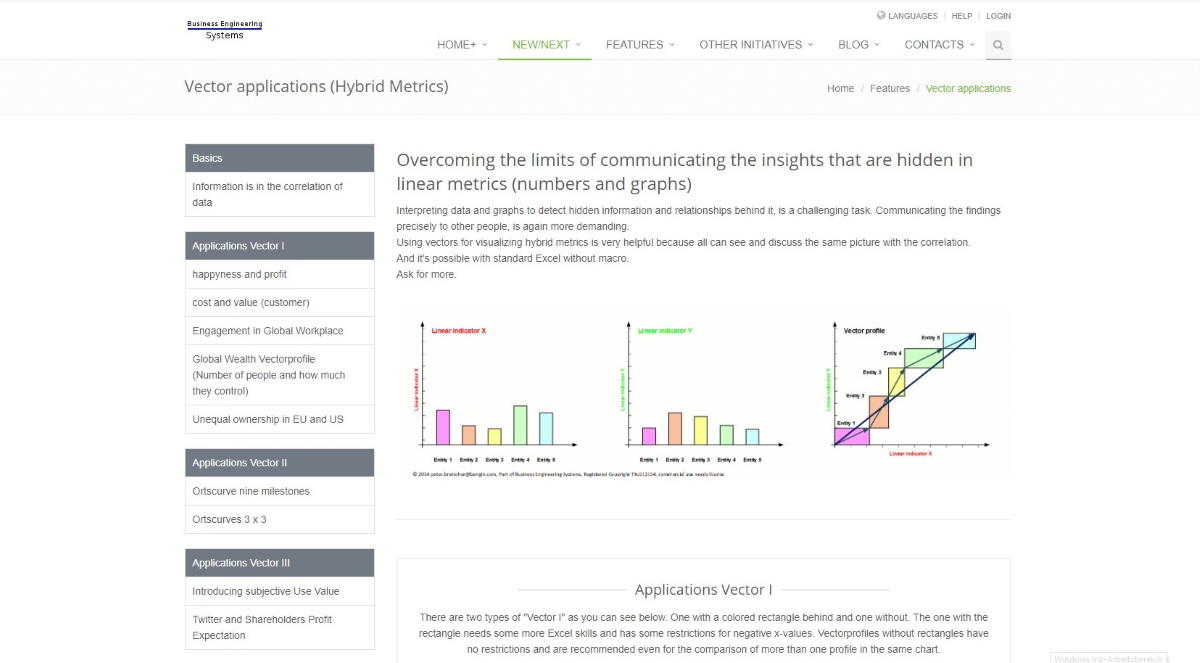
Go to visualizing Hybrid Metrics as Value Profiles in EXCEL.
Go to templates

Go to interactive Excel (in web) at "winformation.org"
(= Weighted Information)
link here
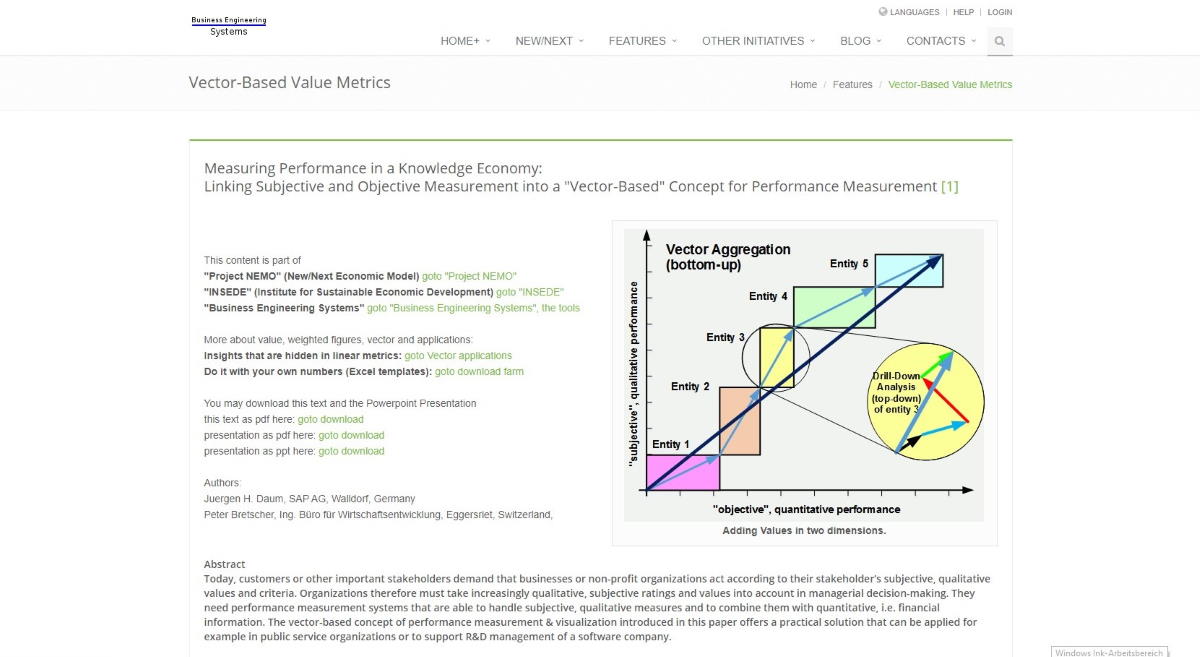
Read "Measuring Performance" in Hybrid Metrics Framework
link here
Take the experience of FSG using Hybrid Metrics.
Go to the FSG special page.
The Goal of 'Project NEMO' (New/Next Economic Model) is to enhance classic economics by
(i) including intangible assets and needs as the common (re)source of welfare and wealth and
(ii) disclosing a vector based hybrid value principle enabling monetary AND nonmonetary dimensions as a compound/hybrid measure.
