Magic Profiles©:
Unlocking Hidden Insights with Vector-Profiles and Hybrid Metrics
Enhance Transparency using Magic Profile© with Hybrid Metrics and Hybrid Reporting
Deloitte (The Netherlands) disclosed in a new paper:
Advancing DMA (Double Materiality Assessment) through IMV (Impact Measurement and Valuation).
How a quantitative approach can support to focus on what matters most.
Click here for going to that page. There you may download the document.
Authors: Frits Klaver, Inga Trofimova, Alissa Griffioen, Annoek Reitsema, Tatiana Kan, Wim Bartels, Arjan de Draaijer
Deloitte asked for feedback and suggestions for its excellent first step towards integrating IMV into DMA.
And that's why 'Magic Profile'© comes in. It enables to visualize the the elements of Deloittes' quadrant in the form of a profile with a sum.
It's even possible to drill down the elements of Deloittes' quadrants like the profiles in the example of Gartners' 'Magic Quadrant' here.
In short:
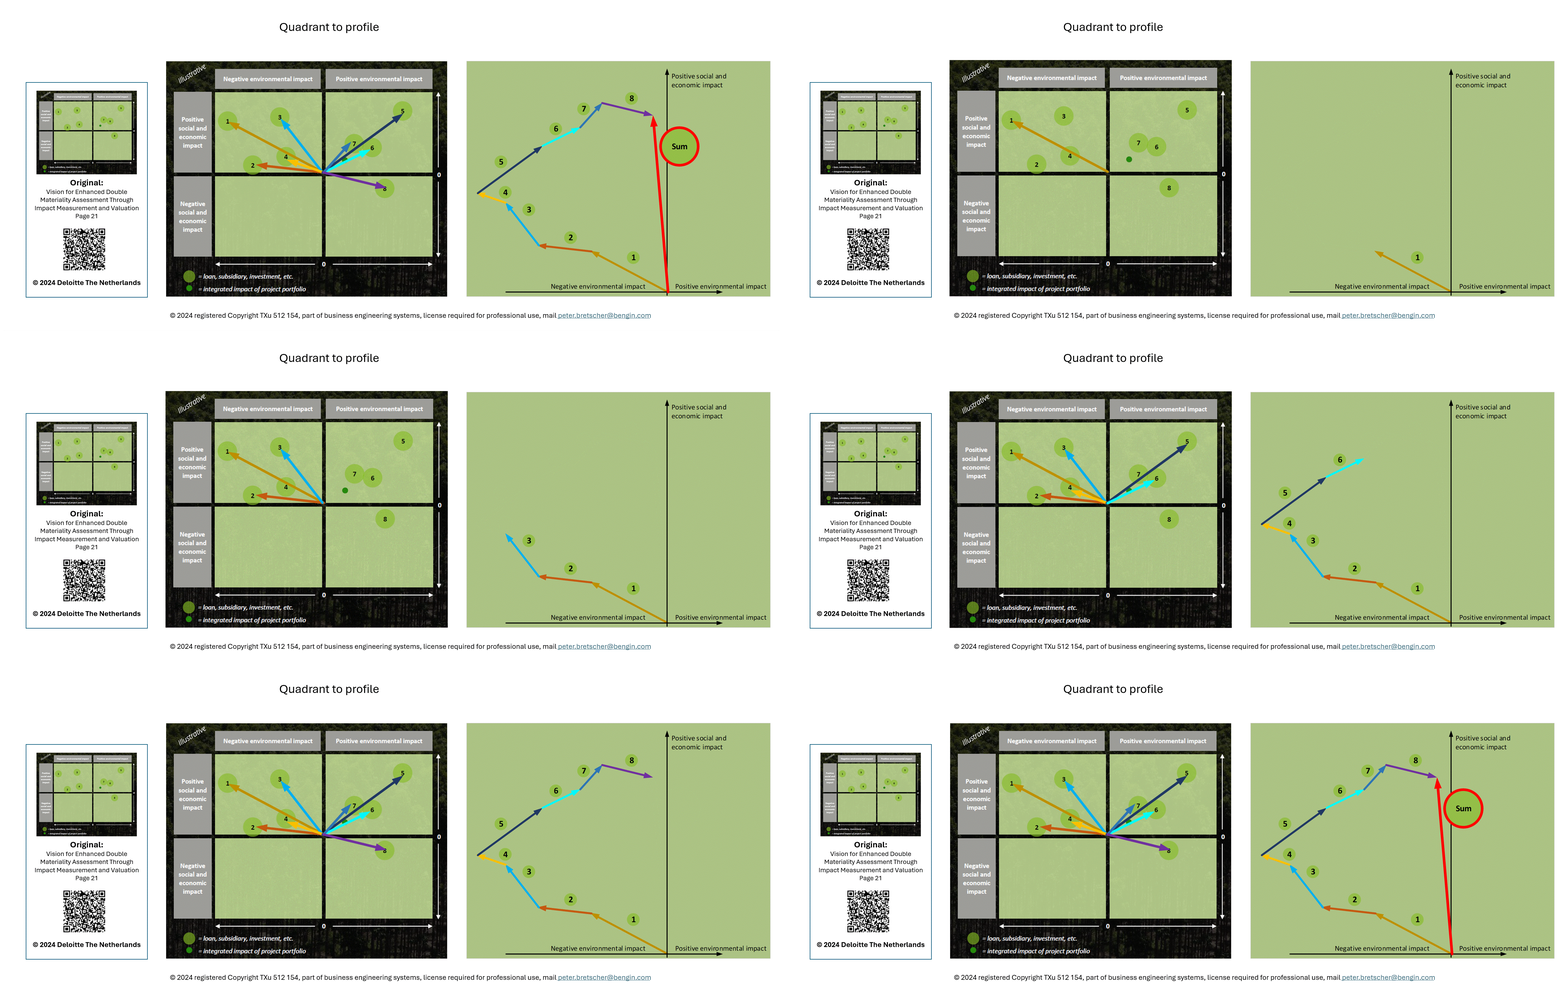
Deloitte (Netherlands) just disclosed the new process with its elements and a graphic of its framework (quadrant) to the financial sector and holding companies at page 21 of the paper mentioned above.
It's the left (smaller) diagram above with four quadrants and eight 2D-Data-points.Middle diagram shows how 'Magic Profile'© uses vectors pointing with the arrows to the eight (2D) data-points. Visualizing distance and direction.
Right diagram is the addition of that arrows (= Vectors) to a value-profile. Adding these vectors graphically visualizes an integral profile with the 2D sum (or resultant) of all indicators. It's like an individual fingerprint of the audit..
This form of visualization provides transparency over the impact of audited elements by creating a profile for any multidimensional data points. It introduces a novel fundamental approach in economics to examine data and pinpoint risks and opportunities for strategic discussion and optimization.
Comparing multiple profiles further enhances insights for decision optimization and communication, fostering wider acceptance. This approach is applicable in various directions, including peer comparisons, bottom-up and top-down analyses and much more.
To keep in mind:
Observe the distinction between considering mere 2D points and examining length with direction, and how this contributes to a vector profile. View each profile as a unique fingerprint or 'gene sequence' of an audit. Picture how straightforward it now becomes to compare even different fingerprints, such as audits and valuations of elements.
Instantly identify where risks and new opportunities are. This aids in peering into the ‘black boxes’ to understand what’s happening inside them.
The vector based Value-Profile gives you an instant insight of all dimensions of quantitative and qualitative impact dimensions. And enables you to choose the right and sustainable trac of the valued elements/clusters)
Please note: 'Magic Profile'© is a development of 'Project NEMO' (New/Next Economic Model) and part of 'Business Engineering Systems' that makes 'Business Administration' smarter and helps responsible people in industry and politic to make more sustainable decisions. Copyright is registered (TXu 512 154).
For professional use (you or your employer invoice customers) we charge moderate license fees for covering our investment (now CHF > 6.5 mio.) and the further development of innovative models and tools enabling the development smarter economies and nations on a human base.
We are thinking of opening up 'Project NEMO' and turning it into a start-up. Anyone who is interested is invited to contact us with their own ideas. This is the quickest way for us to balance the options and interests. E-mail below.
This principle works for other applications too.
The ‘magic’ of 'Magic Profile'© is in its innovative method of visualizing multidimensional data, particularly in the field of economics. Visualization is a crucial aspect in any scientific and engineering discipline, as it provides profound insights, fosters understanding, and ensures a lasting knowledge transfer.
Below some other solutions from the "measuring and visualizing multidimensional metrics" part. Download and try Excel templates. No registration or credit card needed.
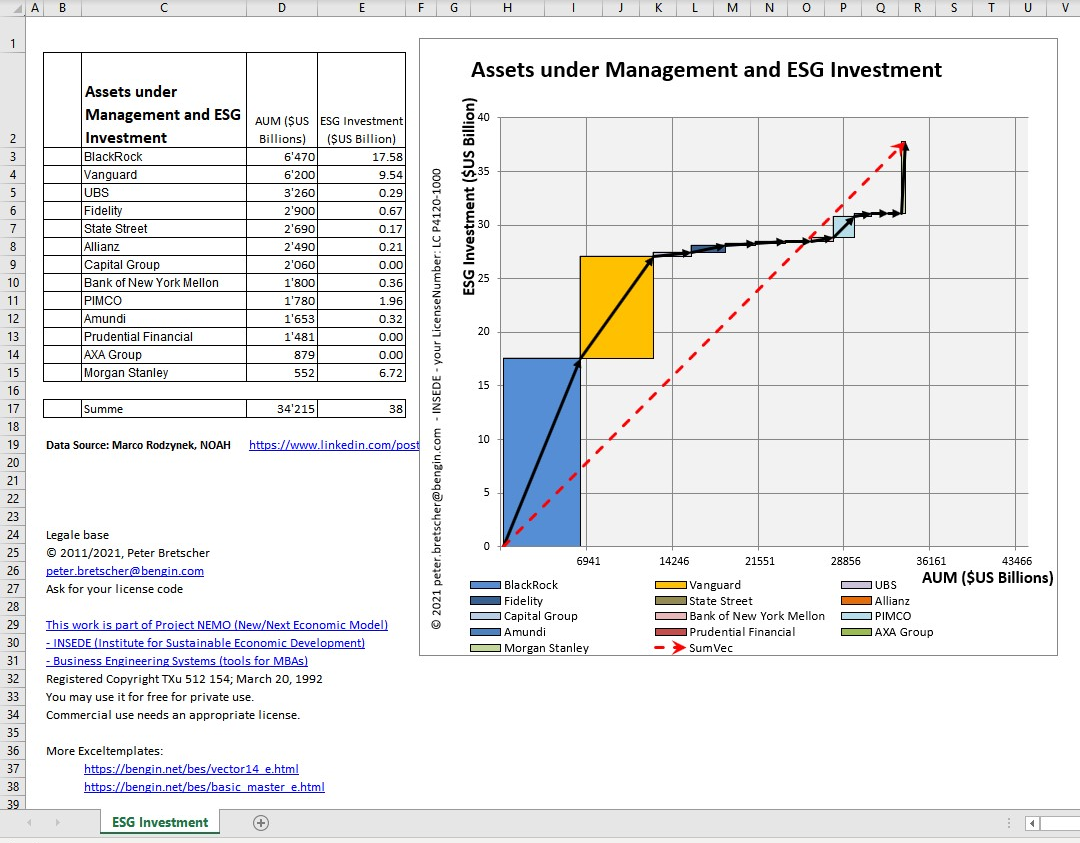
Hybrid Metrics in Boxes.
Download Excel

Numbers visualized in a profile -
Download Excel Template here

Another visualization option
Enhanced Excel Template here
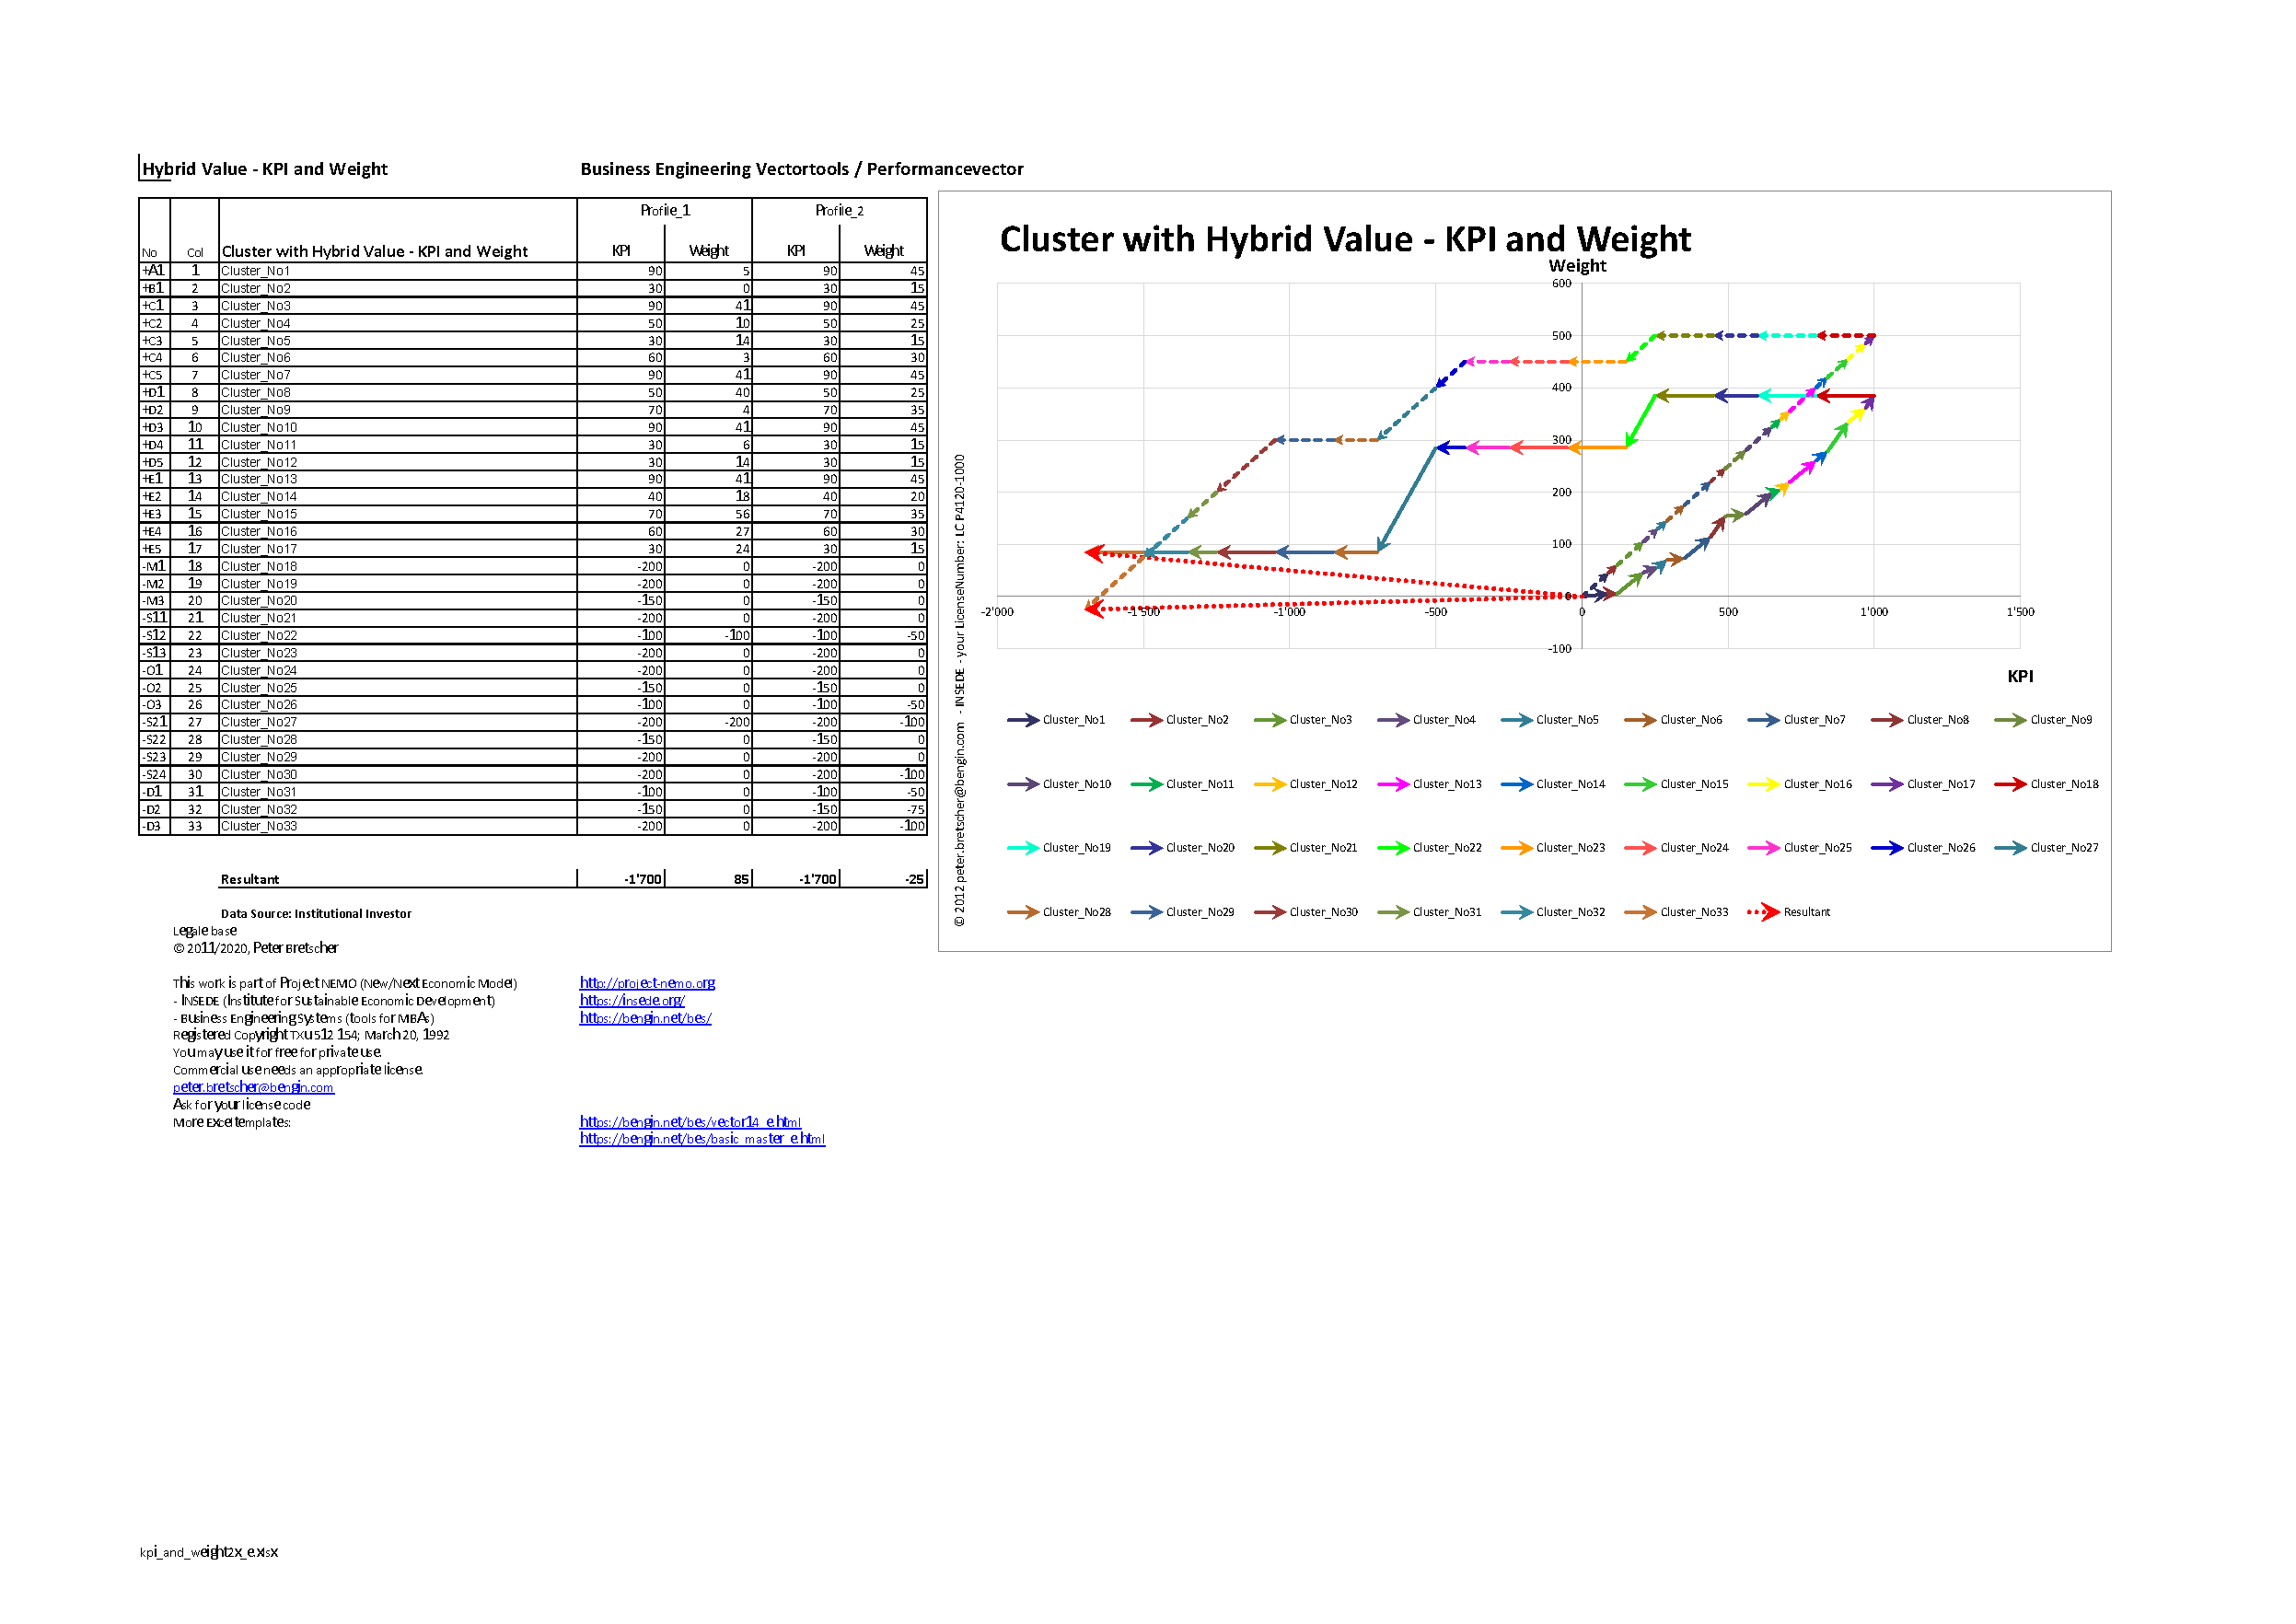
Want to compare two profiles? Download template here
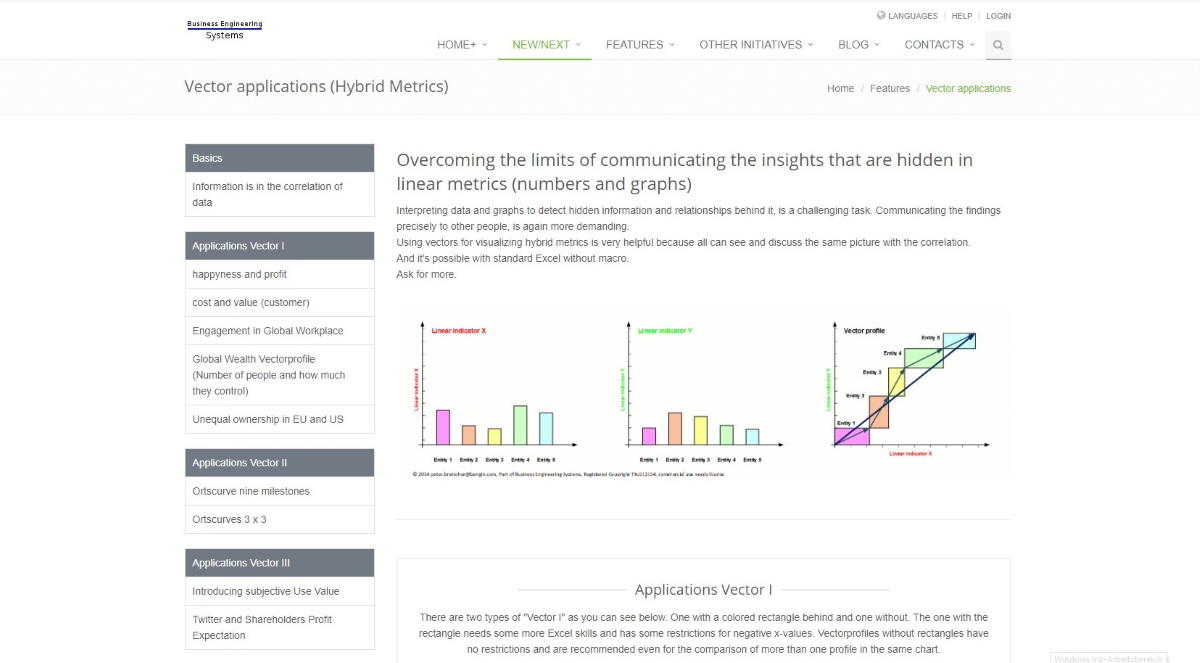
Go to visualizing Hybrid Metrics as Value Profiles in EXCEL.
Go to templates

Go to interactive Excel (in web) at "winformation.org"
(= Weighted Information)
link here
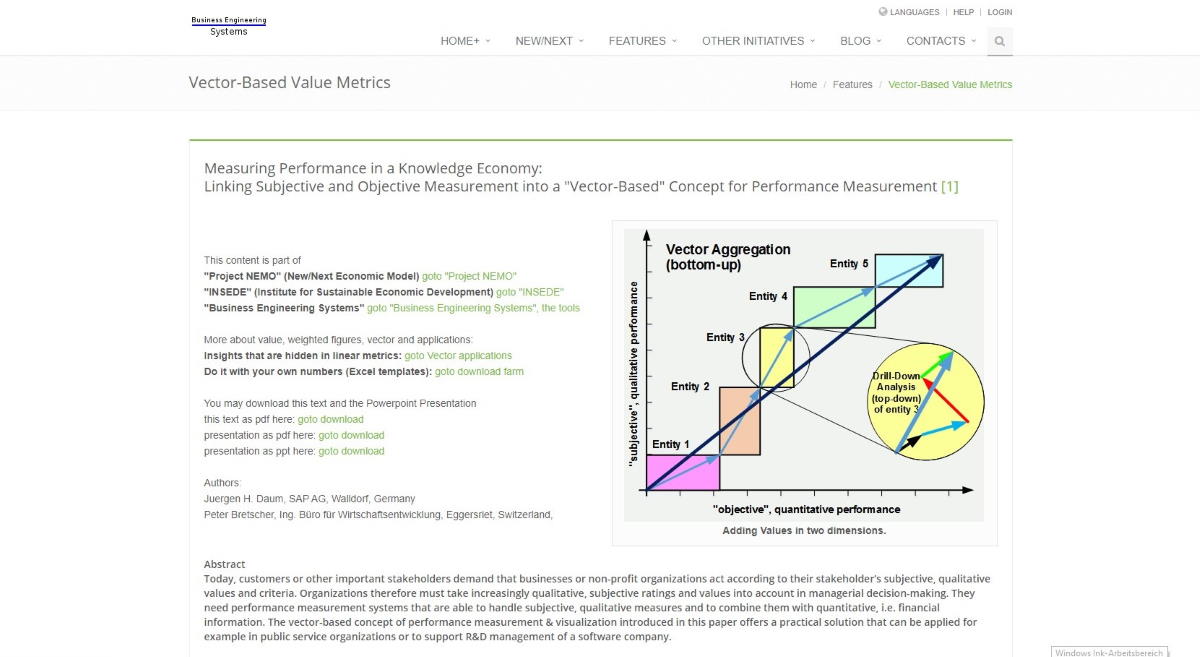
Read "Measuring Performance" in Hybrid Metrics Framework
link here
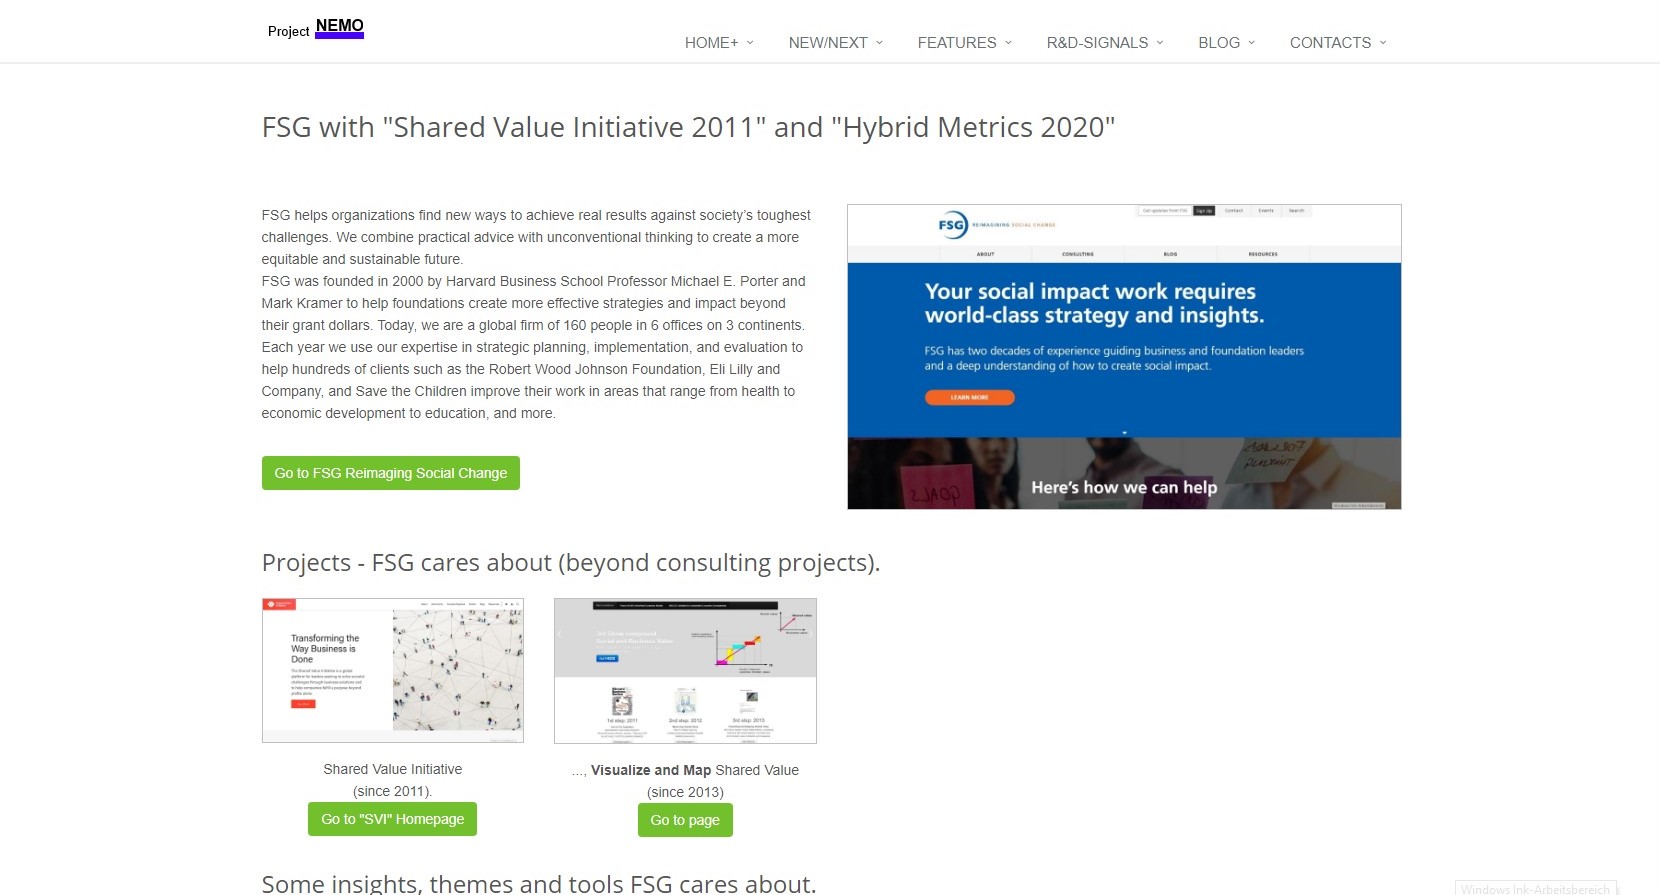
Take the experience of FSG using Hybrid Metrics.
Go to the FSG special page.
The Goal of 'Project NEMO' (New/Next Economic Model) is to enhance classic economics by
(i) including intangible assets and needs as the common (re)source of welfare and wealth and
(ii) disclosing a vector based hybrid value principle enabling monetary AND nonmonetary dimensions as a compound/hybrid measure.
